Introduction
Many nursing students understand how to compare two groups at one point in time, but they become confused when the same patients, nurses, caregivers, students, or clinical units are measured repeatedly. The dataset suddenly has baseline scores, follow-up scores, missing visits, repeated IDs, time variables, and several possible models. A student may wonder: Should I use repeated measures ANOVA? A mixed effects model? GEE? A growth curve model? How do I explain the results in Chapter 4 without sounding too statistical?
That is where applied longitudinal data analysis becomes important.
Applied longitudinal data analysis helps nursing researchers study change over time. Instead of asking only whether two groups differ today, longitudinal analysis asks whether outcomes improve, decline, stabilize, or change differently across follow-up.
Nursing and healthcare researchers often collect repeated data from the same people or settings. For example:
- Pain scores before and after an intervention
- Medication adherence across 6 months
- Nurse burnout across semesters
- Wound healing over weekly clinic visits
- Quality-of-life scores across treatment cycles
- Patient satisfaction after discharge
- Nursing student confidence during clinical placement
- Readmission risk after discharge education
These are not simple one-time outcomes. They are patient outcomes over time, nurse outcomes over time, or healthcare process outcomes over time.
Applied longitudinal data analysis is useful because repeated measurements from the same participant are related. A patient’s week 4 pain score is usually connected to that patient’s baseline pain score. A nurse’s burnout score in semester two may be related to their burnout score in semester one. Longitudinal methods account for this within-person relationship instead of treating every observation as independent. Standard longitudinal analysis texts emphasize that repeated observations require methods that address correlation, time, missing follow-up, and individual change (Diggle et al., 2002; Fitzmaurice et al., 2011).
This article explains applied longitudinal data analysis in nursing research in a practical way. It focuses on method selection, data preparation, interpretation, clinical meaning, and dissertation reporting without becoming a full statistics textbook.
Students who feel unsure about choosing or interpreting a longitudinal method may benefit from guided support with repeated measures data preparation, model selection, output interpretation, APA tables, and dissertation results writing.
What Is Applied Longitudinal Data Analysis?
Applied longitudinal data analysis is the practical analysis of data collected from the same participants or units at multiple time points. In nursing research, the repeated unit may be a patient, nurse, student, caregiver, family member, ward, clinic, hospital, or community health program.
The goal is to understand how an outcome changes over time and what explains that change.
For example, a student may ask:
- Do pain scores decrease after a nurse-led pain education intervention?
- Does medication adherence improve after structured patient teaching?
- Does nurse burnout increase during high-workload semesters?
- Does clinical confidence improve during practicum?
- Does wound size decrease across weekly follow-up visits?
The word applied matters because the focus is not on mathematical derivation. It is on choosing a method that fits the nursing research question, preparing the dataset correctly, interpreting the output accurately, and explaining the findings clearly in a dissertation, thesis, or capstone project.
Cross-Sectional Data
Cross-sectional data are collected at one point in time. For example, a student may measure burnout among 250 nurses once. This can describe burnout levels, but it cannot show whether burnout increased or decreased.
Repeated Measures Data
Repeated measures data are collected from the same participants at several time points. For example, pain may be measured at baseline, 24 hours, 48 hours, and 72 hours after surgery.
Longitudinal Data
Longitudinal data involve repeated observations over time, usually with interest in change, predictors of change, individual differences, missing follow-up, or group differences over time.
Panel Data
Panel data also involve repeated observations, often from people, hospitals, clinics, wards, or organizations. A healthcare panel dataset may track quarterly patient satisfaction scores across several clinics.
Time-Series Data
Time-series data usually involve many repeated observations from one system or unit. For example, a hospital may track daily fall rates before and after a safety intervention.
The central idea is the same: longitudinal analysis helps researchers study outcomes as they unfold over time.
Why Longitudinal Data Analysis Matters in Nursing Research
Nursing research often focuses on improvement, recovery, decline, adaptation, learning, or sustained behavior change. These processes cannot always be understood with a single measurement.
A nurse-led education intervention may not improve medication adherence immediately, but adherence may improve by 3 months and remain stable at 6 months. A clinical confidence program may show little effect after one week but stronger effects after students complete several patient-care experiences. A wound care intervention may require weekly follow-up before meaningful healing patterns appear.
Longitudinal data analysis in healthcare helps students answer questions such as:
- Did patient outcomes improve after a nursing intervention?
- Did one group improve faster than another?
- Did nurse burnout change across time?
- Did medication adherence remain stable after education?
- Did pain reduction become clinically meaningful?
- Did nursing students gain confidence during placement?
- Did missing follow-up affect interpretation?
This is why longitudinal analysis is not simply “running repeated measures ANOVA.” Repeated measures ANOVA may be appropriate for some simple designs, but applied longitudinal data analysis also includes participant-level correlation, missing follow-up, unequal time intervals, model selection, and interpretation of clinically meaningful change.
For broader context, students may first review data analysis in nursing research and quantitative data analysis in nursing research.
Common Nursing Research Questions That Need Longitudinal Analysis
Applied longitudinal data analysis begins with the research question. The method should fit the outcome, time points, missing data pattern, and interpretation goal.
| Nursing research topic | Participants | Outcome variable | Time variable | Possible analysis approach |
|---|---|---|---|---|
| Postoperative pain | Surgical patients | Pain score | Baseline, 24, 48, 72 hours | Repeated measures ANOVA or mixed model |
| Medication adherence | Patients with chronic illness | Adherence score | Baseline, 3 months, 6 months | Mixed effects model or GEE |
| Nurse burnout | Nurses or nursing students | Burnout score | Semester 1, 2, 3 | Growth curve model or mixed model |
| Wound healing | Patients with chronic wounds | Wound size or healing score | Weekly visits | Mixed model or time-to-event model |
| Oncology quality of life | Oncology patients | Quality-of-life score | Treatment cycles | Mixed model |
| Clinical confidence | Nursing students | Confidence scale | Pre-placement, mid-placement, post-placement | Growth curve model or repeated measures ANOVA |
For example, a longitudinal nursing workforce study may follow new nurses during their first year of employment to examine stress patterns and transition challenges (Fang et al., 2022). A nursing education study may follow student nurses over time to examine changes in stress and self-esteem (Edwards et al., 2010).
These examples show why longitudinal nursing research is valuable. It helps students explain not only whether an outcome exists, but whether it changes in a meaningful direction.
Key Features of Longitudinal Data
Repeated Measurements
Repeated measurements mean the same participant contributes more than one observation. For example, Patient 001 may have blood pressure, adherence, or pain scores at baseline, 3 months, and 6 months.
These observations are connected because they come from the same person. A patient with poor adherence at baseline may still have lower adherence later than other patients. This relationship must be considered during analysis.
Time Points
Time points are the measurement occasions. They may be fixed, such as baseline, 3 months, and 6 months, or flexible, such as clinic visits that occur at different intervals.
Time must be coded clearly. If baseline is coded inconsistently or follow-up visits are mislabeled, the model may answer the wrong question.
Baseline and Follow-Up
Baseline is the starting measurement. Follow-up measurements show what happens later.
For example, in a nurse-led medication education study, baseline adherence is measured before education. Follow-up adherence may be measured at 3 months and 6 months.
Within-Subject Correlation
Within-subject correlation means that repeated measurements from the same participant are related. This is one of the main reasons longitudinal methods are needed.
If the analysis ignores this correlation, standard errors, confidence intervals, and p-values may be inaccurate.
Time-Varying Variables
A time-varying variable changes across follow-up. Pain, adherence, wound size, fatigue, stress, confidence, and quality of life can all change over time.
Some predictors can also be time-varying. For example, staffing level, medication changes, clinical placement setting, or symptom severity may change during the study.
Between-Person Differences
Participants may start at different baseline levels and change at different rates. One patient may have high pain at baseline and improve quickly. Another may begin with moderate pain and improve slowly.
Mixed effects models are useful because they can account for participant-level differences in starting points and, when appropriate, differences in change over time (Fitzmaurice et al., 2011).
Missing Data and Attrition
Missing data are common in nursing studies. Patients may miss follow-up visits, transfer facilities, withdraw, die, or leave surveys incomplete. Nurses may change jobs or miss survey waves. Students may change placement sites.
Attrition occurs when participants drop out over time. If attrition is ignored, results may overrepresent participants who remained in the study.
Unequal Follow-Up Intervals
Some studies measure everyone at the same time points. Others have unequal intervals. For example, one wound care patient may return after 7 days and another after 10 days.
Traditional repeated measures ANOVA is less flexible with unequal intervals, while mixed models can often handle more complex timing structures.
Clustering in Hospitals, Wards, or Clinics
Nursing data may be clustered within hospitals, wards, clinics, classrooms, or placement sites. Patients in the same clinic may receive similar care. Students in the same placement site may share similar experiences.
When clustering is important, the analysis may need to account for both repeated measures and group-level structure.
Main Applied Longitudinal Data Analysis Methods
The best method depends on the research question, outcome type, time points, missing data, and interpretation goal. The goal is not to choose the most advanced method. The goal is to choose the method that best answers the nursing research question.
Repeated Measures ANOVA
Repeated measures ANOVA can be used when the same continuous outcome is measured at a few fixed time points.
Example: A student compares mean pain scores at baseline, 24 hours, 48 hours, and 72 hours after surgery.
Repeated measures ANOVA is easier to explain than many advanced models, but it is less flexible when there is missing follow-up, unequal follow-up timing, complex grouping, or time-varying predictors. Researchers have noted that mixed models provide more flexible options for repeated-measures designs than traditional ANOVA in many situations (Gueorguieva & Krystal, 2004).
Linear Mixed Effects Models
Linear mixed effects models are often used when a continuous outcome is measured repeatedly. Examples include pain scores, burnout scores, medication adherence scale scores, quality-of-life scores, wound scores, or confidence scores.
A mixed model can account for repeated observations within participants. It can include fixed effects, such as time and group, and random effects, such as participant-level random intercepts. A random intercept allows each participant to have their own starting point.
Example: A student measures pain scores at baseline, week 4, week 8, and week 12 in intervention and control groups. A linear mixed effects model can estimate whether pain changed over time and whether the intervention group changed differently from the control group.
This method is often useful when there are more than two time points, incomplete follow-up, or unequal spacing between measurements.
Generalized Linear Mixed Models
Generalized linear mixed models are used when the repeated outcome is not continuous.
Examples include:
- Fall or no fall
- Readmitted or not readmitted
- Adherent or non-adherent
- Presence or absence of infection
- Number of symptoms
- Number of missed medication doses
For example, if medication adherence is coded as “adherent” or “not adherent” at each visit, a generalized linear mixed model may be more appropriate than a linear mixed model.
Generalized Estimating Equations
Generalized estimating equations, or GEE, are useful when the researcher wants a population-average estimate across repeated measurements. GEE was developed for correlated longitudinal data and is commonly used in healthcare and epidemiological research (Liang & Zeger, 1986).
Example: A researcher studies whether a nurse-led education program increases the probability of medication adherence across baseline, 3 months, and 6 months.
GEE is often useful when the focus is on the average change in the population rather than individual-specific trajectories.
Growth Curve Modeling
Growth curve modeling examines patterns of change over time. It is useful when the researcher wants to understand trajectories, such as improvement, decline, acceleration, or slowing change.
Example: A nursing education researcher examines clinical confidence across a practicum. Some students may begin with low confidence and improve quickly, while others may begin with moderate confidence and improve slowly.
Singer and Willett describe longitudinal analysis as a way to model individual change and event occurrence, which is useful when nursing researchers want to understand growth, decline, transition, or recovery over time (Singer & Willett, 2003).
Survival or Time-to-Event Analysis
Survival analysis is used when the outcome is time until an event.
Nursing examples include:
- Time to readmission
- Time to wound healing
- Time to discharge
- Time to first fall
- Time to medication discontinuation
This article does not turn survival analysis into a full guide because it is a separate method. The main point is that survival analysis is appropriate when the timing of an event is the outcome.
Choosing the Right Longitudinal Analysis Method
Choosing the right method is one of the most important decisions in applied longitudinal data analysis. Students should not choose a model only because it appears in SPSS or because another student used it. The method should match the research question and dataset.
| Decision factor | Student question | Practical guidance |
|---|---|---|
| Number of time points | Do I have 2, 3, or many follow-ups? | More time points often support mixed models or growth models. |
| Outcome type | Is the outcome continuous, binary, count, or time-to-event? | Continuous outcomes may use mixed models; binary/count outcomes may need generalized models or GEE. |
| Missing data | Are some follow-up values missing? | Mixed models may be more flexible than repeated measures ANOVA when appropriate assumptions are met. |
| Time intervals | Are time points equal for everyone? | Unequal intervals often require more flexible longitudinal methods. |
| Interpretation goal | Do I want individual change or group-average change? | Mixed models often support individual-level modeling; GEE supports population-average effects. |
| Intervention design | Do I have intervention and control groups? | Focus on time, group, and group-by-time interaction. |
| Software | What software can I access and explain? | SPSS, R, Stata, SAS, Jamovi, and Mplus may all be options depending on the model. |
| Dissertation expectations | What does my supervisor or university require? | The method must be defensible and clearly reported. |
A simple rule is:
Use repeated measures ANOVA only when the design is simple, the outcome is continuous, time points are fixed, and assumptions are reasonable.
Use mixed models when repeated data are more complex, especially when participants have missing follow-up, unequal timing, or individual differences that matter.
Make use of GEE when the main interest is the average effect across the population.
Use survival analysis when the outcome is time until an event.
Preparing Nursing Data for Longitudinal Analysis
Data preparation can determine whether the analysis is correct. A good model cannot fix a poorly structured dataset.
Before analysis, students should check:
- Participant IDs
- Time variables
- Baseline values
- Follow-up values
- Missing data patterns
- Duplicate records
- Outliers
- Intervention and control group coding
- Date or visit consistency
- Variable labels
- Scale scoring
- Data-cleaning decisions
For example, if one patient has two records for the same 3-month follow-up visit, the student must determine whether this is a duplicate, a correction, or a separate measurement. If baseline values are placed in the wrong column or coded as follow-up, the interpretation of change will be wrong.
A strong nursing dissertation should document data-cleaning decisions in the methodology or data analysis section.
Long Format vs Wide Format in Longitudinal Data
Longitudinal data are often organized in either wide format or long format. Understanding the difference is essential for SPSS longitudinal data analysis, R longitudinal data analysis, mixed models, and GEE.
Wide Format
In wide format, each participant has one row. Each time point has a separate column.
| ID | Group | Pain_Baseline | Pain_Week4 | Pain_Week8 | Pain_Week12 |
|---|---|---|---|---|---|
| 001 | Intervention | 8 | 6 | 4 | 3 |
| 002 | Control | 7 | 7 | 6 | 6 |
| 003 | Intervention | 9 | 6 | 5 | 4 |
Wide format is common in spreadsheets and simple repeated measures ANOVA workflows.
Long Format
In long format, each participant has multiple rows, one row per time point.
| ID | Group | Time | Pain_Score |
|---|---|---|---|
| 001 | Intervention | Baseline | 8 |
| 001 | Intervention | Week 4 | 6 |
| 001 | Intervention | Week 8 | 4 |
| 001 | Intervention | Week 12 | 3 |
| 002 | Control | Baseline | 7 |
| 002 | Control | Week 4 | 7 |
| 002 | Control | Week 8 | 6 |
| 002 | Control | Week 12 | 6 |
Many mixed models, GEE models, and growth curve models commonly require long-format data. The practical structure is:
Participant ID + time variable + outcome variable + group/predictor variables
If the dataset is in the wrong format, the software may not run the intended model or may produce results that are hard to interpret.
Missing Data in Longitudinal Nursing Research
Missing data are common in longitudinal nursing and healthcare studies. Students should expect some missing follow-up, especially in patient studies, workforce studies, and student follow-up designs.
Missing data may occur because of:
- Missed follow-up visits
- Patient discharge
- Patient transfer
- Death
- Withdrawal from the study
- Incomplete surveys
- Staff turnover
- Delayed clinical review
- Placement changes
- Missed assessment days
Deleting every participant with one missing value may reduce sample size and weaken the study. It may also bias results if missingness is related to the outcome. For example, patients with worse symptoms may be more likely to miss follow-up appointments. Nurses with higher burnout may be less likely to complete later surveys.
Practical steps include:
- Report the number of participants at each time point
- Examine patterns of missingness
- Compare complete and incomplete cases where appropriate
- Consider whether missingness may be related to the outcome
- Use mixed models when appropriate
- Consider multiple imputation when justified
- Conduct sensitivity analysis if needed
- Explain missing data handling clearly
Mixed models can often use available repeated observations under appropriate assumptions, but they do not magically solve all missing data problems. Students should still describe missing data patterns and justify their approach.
Reporting guidelines also emphasize transparency. STROBE recommends clear reporting of participants, variables, statistical methods, bias, and missing data in observational studies (von Elm et al., 2007). CONSORT recommends clear reporting of trial design, participant flow, outcomes, and statistical methods for randomized trials (Moher et al., 2010).
Interpreting Longitudinal Results in Nursing Research
This is where many students struggle. Applied longitudinal data analysis is not complete when the software output appears. The student must explain what the model means for nursing practice.
A good interpretation answers:
- Did the outcome change over time?
- Did one group have better outcomes overall?
- Did groups change differently over time?
- Was the direction of change expected?
- Was the change clinically meaningful?
- Were confidence intervals wide or narrow?
- Did missing data affect interpretation?
- What does the result mean for nursing practice?
Time Effect
A time effect means the outcome changed across time points.
Example: Pain scores decreased from baseline to 72 hours among postoperative patients.
Interpretation:
“Pain scores declined over time, suggesting recovery after surgery and possible benefit from routine postoperative pain management.”
Group Effect
A group effect means one group had different average outcomes than another group across the study period.
Example: The intervention group had higher average medication adherence than the control group.
Interpretation:
“Patients receiving nurse-led education reported higher adherence across follow-up compared with usual care patients.”
Group-by-Time Interaction
A group-by-time interaction means groups changed differently over time. This is often the most important result in intervention studies.
Example: The intervention group improved from baseline to 6 months, while the control group changed only slightly.
Interpretation:
“The significant group-by-time interaction indicated that adherence improved more rapidly and more substantially in the nurse-led education group than in the usual-care group.”
Clinical Meaning
A statistically significant change may not always be clinically meaningful. Nursing students should explain whether the change matters in real care.
For example:
- A 0.2-point reduction in pain may be statistically significant but not clinically important.
- A 2-point reduction in pain may be meaningful for postoperative comfort.
- A 15-point adherence improvement may matter if it moves patients from poor to acceptable adherence.
- A small burnout score change may matter if it reduces risk of turnover or emotional exhaustion.
A strong dissertation interpretation connects statistics to clinical relevance.
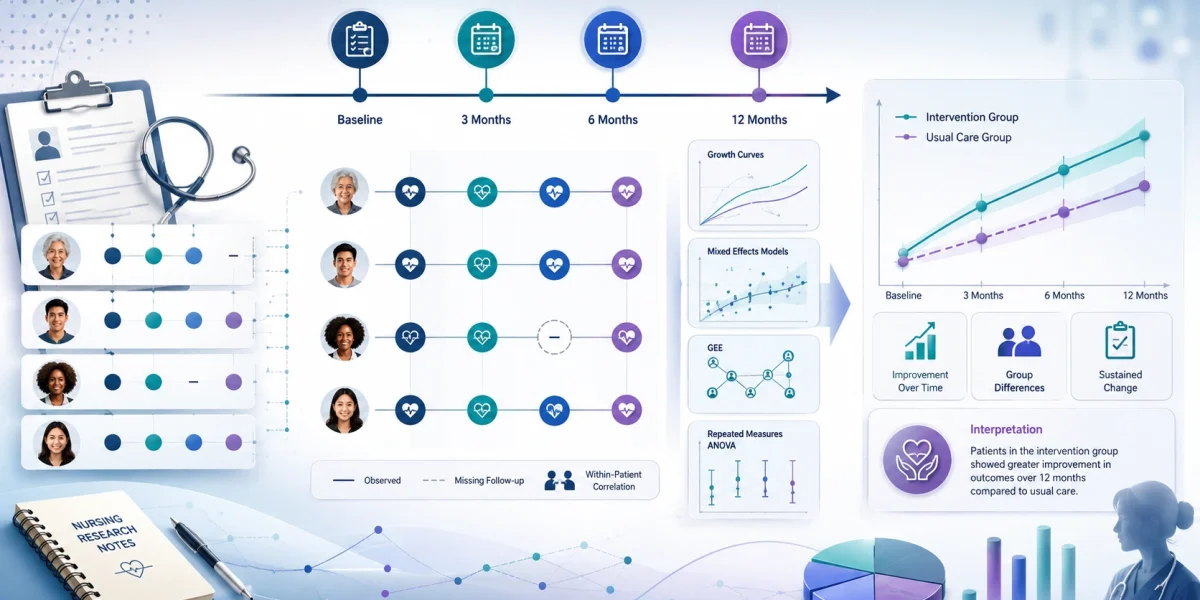
Example of Applied Longitudinal Data Analysis in Nursing Research
Topic: Nurse-Led Education Intervention to Improve Medication Adherence
Research aim:
To examine whether a nurse-led education intervention improves medication adherence among adults with hypertension over 6 months.
Research question:
Does medication adherence improve differently over time among patients who receive nurse-led education compared with patients who receive usual care?
Independent variable:
Group membership: nurse-led education intervention vs usual care.
Dependent variable:
Medication adherence score.
Time variable:
Baseline, 3 months, and 6 months.
Participants:
Adult patients with hypertension attending outpatient clinics.
Data structure:
The dataset is organized in long format, with one row per participant per time point.
| ID | Group | Time | Adherence Score |
|---|---|---|---|
| 001 | Intervention | Baseline | 62 |
| 001 | Intervention | 3 months | 72 |
| 001 | Intervention | 6 months | 80 |
| 002 | Control | Baseline | 61 |
| 002 | Control | 3 months | 64 |
| 002 | Control | 6 months | 66 |
Possible statistical method:
A linear mixed effects model may be appropriate if adherence is measured as a continuous score. If adherence is coded as adherent vs non-adherent, a generalized linear mixed model or GEE may be more appropriate.
Mock Summary of Results
| Group | Baseline mean | 3-month mean | 6-month mean | Pattern |
|---|---|---|---|---|
| Nurse-led education | 62 | 72 | 80 | Strong improvement |
| Usual care | 61 | 64 | 66 | Small improvement |
Possible Interpretation
Both groups improved over time, but the nurse-led education group improved more. The group-by-time interaction suggests that the intervention was associated with greater improvement in medication adherence across follow-up.
The finding is clinically meaningful if the improvement represents better medication-taking behavior, fewer missed doses, better blood pressure control, or stronger self-management.
Dissertation Reporting Example
“A linear mixed effects model was used to examine changes in medication adherence across baseline, 3-month, and 6-month follow-up. The model included time, group, and the group-by-time interaction as fixed effects, with participant-level random intercepts to account for repeated observations. Results showed a significant group-by-time interaction, indicating that adherence improved more in the nurse-led education group than in the usual-care group. The improvement was clinically meaningful because the intervention group showed sustained gains at 6 months, suggesting that structured nurse-led education may support long-term adherence behavior.”
This example shows how applied longitudinal data analysis connects method choice, model output, clinical interpretation, and dissertation writing.
How to Report Longitudinal Data Analysis Results
A strong nursing dissertation, thesis, or capstone should report both the statistical method and the nursing meaning of the results.
Students should include:
- Study design
- Sample size
- Number of time points
- Outcome variable
- Statistical method used
- Reason the method was chosen
- Time effect
- Group effect
- Group-by-time interaction
- Confidence intervals
- p-values
- Effect sizes where appropriate
- Missing data handling
- Clinical interpretation
Sample Chapter 3 Methodology Wording
“Longitudinal data analysis was used because medication adherence was measured repeatedly from the same participants at baseline, 3 months, and 6 months. A linear mixed effects model was selected to account for correlation among repeated observations and to estimate changes in adherence over time. The model included time, group, and the group-by-time interaction as fixed effects, with participant-level random intercepts included to account for repeated measurements within participants.”
Sample Chapter 4 Results Wording
“The linear mixed effects model showed a significant group-by-time interaction, indicating that medication adherence changed differently across follow-up for the intervention and control groups. The nurse-led education group showed greater improvement from baseline to 6 months than the usual-care group.”
Sample Clinical Interpretation Wording
“The improvement in medication adherence suggests that structured nurse-led education may support sustained self-management among adults with hypertension. The change was not only statistically significant but also clinically relevant because the intervention group demonstrated continued improvement at 6 months.”
Sample Missing Data Wording
“Missing follow-up observations were examined by time point. Participants with incomplete follow-up data were retained in the mixed model where appropriate, allowing available repeated observations to contribute to the analysis.”
Sample APA-Style Results Sentence
“Medication adherence increased over time in both groups; however, the increase was larger in the nurse-led education group, as shown by the significant group-by-time interaction.”
Students who need broader results-writing support can review nursing dissertation data analysis help.
Common Mistakes Students Make in Applied Longitudinal Data Analysis
Treating Repeated Observations as Independent
Repeated observations from the same participant are related. Treating them as independent can distort standard errors and p-values.
Fix: Use a method that accounts for within-participant correlation.
Using Several t-Tests Instead of a Longitudinal Model
Running many separate t-tests can create confusion and increase the risk of misleading results.
Fix: Use a longitudinal method that evaluates change across all relevant time points.
Ignoring Missing Follow-Up Data
Missing data are common in healthcare research. Ignoring them may bias results.
Fix: Examine missing data patterns, report attrition, and justify the missing data approach.
Using Repeated Measures ANOVA When Assumptions Are Not Met
Repeated measures ANOVA may be inappropriate when data have missing follow-up, unequal intervals, or complex structures.
Fix: Consider mixed models or GEE when the design requires more flexibility.
Failing to Define the Time Variable Clearly
Time must be coded consistently.
Fix: Define whether time is categorical, such as baseline, 3 months, and 6 months, or continuous, such as weeks since enrollment.
Confusing Baseline Differences With Change Over Time
Groups may differ at baseline, but that does not automatically mean they changed differently.
Fix: Interpret baseline values, time effects, group effects, and group-by-time interactions separately.
Ignoring the Group-by-Time Interaction
In intervention studies, the group-by-time interaction often answers the main research question.
Fix: Explain whether the intervention group changed differently from the control group.
Reporting Statistical Significance Without Clinical Meaning
A statistically significant result may not matter clinically.
Fix: Explain whether the change affects patient care, nursing practice, education, safety, or health outcomes.
Failing to Explain Why the Method Was Chosen
Students sometimes name the model without justification.
Fix: Link the method to repeated observations, outcome type, missing data, time points, and the research question.
Using the Wrong Data Format
Some models require long-format data.
Fix: Confirm the required data structure before running the model.
Not Aligning the Analysis With the Research Questions
A model should answer the research question directly.
Fix: Match the outcome, time variable, group variable, and interaction terms to the research question.
Overloading the Results Chapter With Unnecessary Statistics
Too many technical details can confuse readers.
Fix: Report the statistics needed to answer the research question, then explain the nursing meaning.
Software for Applied Longitudinal Data Analysis
Several software programs can be used for applied longitudinal data analysis.
SPSS
SPSS can be useful for repeated measures ANOVA and some mixed models. It is familiar to many nursing students and may be preferred in some programs. However, SPSS longitudinal data analysis still requires correct data setup, model selection, and interpretation.
R
R is flexible for mixed models, generalized models, GEE, visualization, and reproducible analysis. Though R longitudinal data analysis is powerful, students need more coding confidence.
Stata
Stata is widely used in health, epidemiology, and policy research. It is strong for panel data, mixed models, GEE, survival analysis, and applied healthcare modeling.
SAS
SAS is commonly used in clinical, public health, and institutional research settings. It is powerful for longitudinal and repeated measures analysis but may require more technical training.
Jamovi
Jamovi may be helpful for some student-level repeated measures and mixed model tasks, depending on available modules and project complexity.
Mplus
Mplus is often used for more advanced longitudinal modeling, growth models, latent variables, and complex structures.
The best software depends on the model, dataset complexity, university requirements, and the student’s skill level. Students should focus on correct data structure, appropriate method selection, and accurate interpretation, not only on software buttons.
Students needing software-specific support can review SPSS data analysis help.
Applied Longitudinal Data Analysis and Mixed Methods Nursing Research
Some nursing studies combine longitudinal quantitative data with qualitative data. For example, a DNP project may measure medication adherence at baseline, 3 months, and 6 months, then interview patients about barriers to adherence.
In this design, longitudinal analysis shows whether adherence changed over time. Qualitative findings help explain why patients improved, struggled, or discontinued medication.
Students using both quantitative and qualitative data should keep each strand clear. The longitudinal model answers the numerical change question. The qualitative analysis explains experience, meaning, barriers, or context.
For deeper guidance, students can review mixed methods data analysis in nursing research.
When Nursing Students May Need Longitudinal Data Analysis Support
Applied longitudinal data analysis can be difficult because it combines research design, data structure, repeated observations, missing follow-up, software output, and clinical interpretation.
Students may need support with:
- Choosing the right longitudinal method
- Preparing long-format data
- Cleaning repeated measures data
- Checking assumptions
- Handling missing follow-up
- Running mixed models or GEE
- Interpreting group-by-time effects
- Writing Chapter 3 methodology
- Writing Chapter 4 results
- Preparing APA 7th edition tables
- Explaining clinical meaning
Ethical support should help students understand and report their analysis accurately. It should not replace the student’s responsibility to learn the method, understand the results, and present the work honestly.
Need help understanding applied longitudinal data analysis for your nursing dissertation, thesis, capstone, or healthcare research project? Our nursing data analysis experts can guide you with method selection, repeated measures data preparation, model interpretation, APA tables, and clear dissertation results writing. Request longitudinal data analysis help today.
Conclusion
Applied longitudinal data analysis is essential in nursing research because many patient, nurse, student, caregiver, and healthcare outcomes change over time. Longitudinal methods help students study improvement, decline, recovery, adherence, burnout, confidence, wound healing, pain, quality of life, and patient outcomes over time.
The best method is not always repeated measures ANOVA. Nursing students must consider the number of time points, type of outcome, missing data, within-participant correlation, group comparisons, unequal intervals, and clinical meaning. Methods such as mixed effects models, generalized linear mixed models, GEE, growth curve modeling, and survival analysis may be appropriate depending on the research question.
A strong nursing dissertation or capstone does more than report p-values. It explains what changed, how groups differed over time, whether the change was clinically meaningful, and what the findings mean for nursing practice.
Students who need guidance can seek ethical support with data preparation, method selection, software output interpretation, APA tables, and clear longitudinal results writing.
FAQs About Applied Longitudinal Data Analysis
What is applied longitudinal data analysis?
Applied longitudinal data analysis is the practical analysis of repeated observations collected from the same participants or units over time. It helps researchers understand change, trends, intervention effects, and outcome patterns.
How is longitudinal data analysis used in nursing research?
Longitudinal data analysis in nursing research is used to study outcomes such as pain, medication adherence, burnout, wound healing, quality of life, patient satisfaction, clinical confidence, readmission, and patient outcomes over time.
What is the difference between repeated measures ANOVA and mixed effects models?
Repeated measures ANOVA is usually used for continuous outcomes measured at a few fixed time points, often with complete data. Mixed effects models are more flexible for repeated observations, missing follow-up, unequal intervals, participant-level differences, and more complex longitudinal designs.
When should I use GEE in longitudinal data analysis?
GEE may be appropriate when the goal is to estimate population-average effects across repeated measurements. It is often used for correlated healthcare outcomes such as adherence status, readmission, falls, symptoms, or repeated binary outcomes.
What is long-format data in longitudinal analysis?
Long-format data means each participant has one row per time point. For example, a patient measured at baseline, 3 months, and 6 months would have three rows in the dataset.
How do I handle missing data in longitudinal nursing studies?
Start by examining missing data patterns and reporting attrition. Depending on the design and assumptions, mixed models, multiple imputation, or sensitivity analysis may be appropriate. Avoid deleting incomplete cases without considering the impact.
Can SPSS or R be used for applied longitudinal data analysis?
Yes. SPSS and R can both be used for applied longitudinal data analysis. SPSS is familiar to many nursing students, while R is more flexible for mixed models, GEE, visualization, and reproducible analysis.
When should I get help with longitudinal data analysis?
You may need help if you are unsure which method to use, how to organize long-format data, how to handle missing follow-up, how to interpret group-by-time effects, or how to write Chapter 3 and Chapter 4 results clearly.