

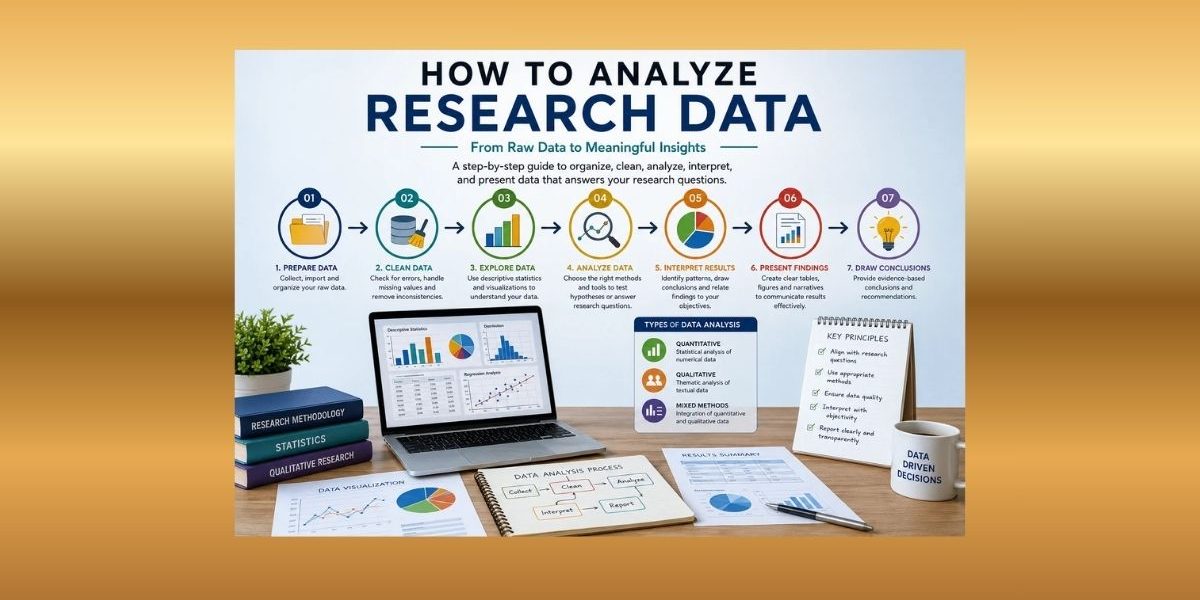
A Comprehensive Guide for Students and Researchers
Introduction
Whether you are writing a dissertation, preparing a journal article or working on a professional report, at some point you need to analyze research data. Data analysis is more than simply running numbers or coding transcripts; it involves systematically organizing, cleaning, examining, interpreting and presenting information so that it answers your research questions or hypotheses. According to the U.S. Office of Research Integrity, data analysis applies statistical or logical techniques to “describe and illustrate, condense and recap, and evaluate data”(Northern Illinois University, 2025). Analysis gives meaning to raw observations and distinguishes genuine patterns from noise. Choosing the correct approach depends on factors such as your research questions, objectives, design, data type (quantitative, qualitative or mixed), sample size, variables, level of measurement and available analytic tools. This guide provides a practical, step‑by‑step roadmap for students and professionals seeking to turn raw data into meaningful findings.
What Is Research Data Analysis?
Research data analysis refers to the procedures used to extract and interpret meaningful information from data so that you can answer your research question. Data typically pass through several stages:
| Stage | Description |
| Raw data | Observations collected directly from participants or instruments (e.g., survey responses, interview recordings, sensor readings). |
| Organized data | Data formatted into tables or transcripts. Numerical data are entered into a spreadsheet; qualitative data are transcribed. |
| Cleaned data | Data corrected for errors, missing values, outliers and inconsistencies so that they are valid for analysis. |
| Analyzed results | Results produced by statistical tests or qualitative coding (e.g., means, regression coefficients, themes). |
| Interpreted findings | Conclusions drawn from the results that address the research questions. |
| Reported findings | Presentation of findings in tables, graphs, charts and narrative form in a dissertation, thesis, journal article or report. |
Data analysis differs from data collection and reporting. It is not merely generating tables or statistics; it is the bridge between raw observations and evidence‑based conclusions. Proper analysis helps ensure that the final report accurately reflects the data and supports your arguments.
Why Research Data Analysis Is Important
Analyzing data properly is crucial because it connects your observations to your research objectives. Proper analysis:
- Tests hypotheses or answers research questions. Statistical analysis helps you determine whether observed differences or relationships are significant. Qualitative analysis uncovers patterns and themes.
- Identifies trends, patterns and relationships. Descriptive statistics summarize typical values and variability, while correlation and regression reveal relationships between variables.
- Improves credibility. Accurate analysis prevents unsupported claims and reduces bias. Qualitative trustworthiness requires credibility, transferability, dependability and confirmability(Korstjens & Moser, 2018).
- Supports evidence‑based decision‑making. Analysis informs recommendations and practice by providing empirical evidence. Without proper analysis, research may lead to incorrect conclusions, rejected dissertations or misleading recommendations.
Conversely, poor analysis risks biased findings, misinterpretation and wasted effort. Mistakes such as ignoring data cleaning or using incorrect statistical tests can undermine the validity of your results. This guide aims to help you avoid common pitfalls and produce rigorous analyses.
Types of Research Data You May Need to Analyze
Quantitative Research Data
Quantitative data are numerical and can be analyzed using statistical methods. Common sources include survey scores, test results, physiological measurements, Likert‑scale responses and demographic variables. Variables can be independent, dependent, control, categorical (nominal or ordinal) or continuous. Quantitative analysis typically involves descriptive statistics, assumption testing, inferential tests and regression modelling.
Qualitative Research Data
Qualitative data are non‑numerical and focus on meaning, experience and interpretation. They include interview transcripts, focus group discussions, open‑ended survey responses, observation notes, diaries, case studies and documents. Qualitative analysis involves coding, theme development and interpretation. Thematic analysis, for example, identifies patterns or themes within data. Trustworthiness is ensured through credibility, transferability, dependability and confirmability.
Mixed‑Methods Research Data
Mixed‑methods research combines quantitative and qualitative data. For instance, a study may collect survey data (quantitative) and follow‑up interviews (qualitative). Analysis involves separately analyzing each dataset, comparing findings, and integrating them to provide a comprehensive understanding. Triangulation of methods or data sources can strengthen conclusion (Korstjens & Moser, 2018).
Before You Analyze: Review the Research Questions and Objectives
Data analysis should always begin with your research questions and objectives. The type of question determines the appropriate analysis method. The table below links question types to suitable approaches.
| Research question type | Example question | Data type | Suitable analysis approach |
| Relationship | “Is there a relationship between study hours and exam scores?” | Quantitative | Correlation and regression analysis. |
| Difference (two groups) | “Do men and women differ in anxiety scores?” | Quantitative | t‑test (parametric) or Mann‑Whitney U test (non‑parametric). |
| Difference (three or more groups) | “Do stress levels differ across three treatment groups?” | Quantitative | ANOVA (parametric) or Kruskal–Wallis test (non‑parametric). |
| Association | “Is educational level associated with employment status?” | Quantitative | Chi‑square test of association. |
| Predictors | “What factors predict job satisfaction?” | Quantitative | Multiple regression. |
| Experience/meaning | “How do nurses perceive telehealth adoption?” | Qualitative | Thematic analysis with coding and theme development. |
| Predictors of categorical outcome | “What factors predict whether students pass or fail?” | Quantitative | Logistic regression. |
| Mixed‑methods | “How do quantitative satisfaction scores align with interview insights?” | Mixed | Analyze quantitative and qualitative separately, then integrate findings. |
Refer back to your research questions before selecting statistical tests or qualitative methods. Aligning analysis with the research aim ensures that you answer the intended questions. Choosing a compelling topic is equally important.
Step‑by‑Step Guide on How to Analyze Research Data
Step 1: Understand the Research Design
Your research design (e.g., experimental, quasi‑experimental, correlational, descriptive, phenomenological, grounded theory, case study, mixed‑methods) determines the analytical approach. Experimental designs often require inferential statistics (e.g., t‑tests, ANOVA). Correlational studies use correlation and regression analyses. Qualitative designs such as phenomenology or grounded theory rely on coding and theme development. Mixed‑methods designs combine both.
If you’re working on a nursing dissertation, selecting an appropriate design can be challenging. You may benefit from resources that provide dissertation data analysis help to choose and justify your methodology.
Step 2: Identify the Type of Data Collected
Classify data as quantitative, qualitative or mixed. For quantitative data, identify variables:
- Independent variables influence or predict outcomes.
- Dependent variables are outcomes you measure.
- Control variables are held constant.
- Categorical variables are nominal (e.g., gender) or ordinal (e.g., Likert scale).
- Continuous variables are interval or ratio (e.g., age, test scores).
For qualitative data, identify sources (e.g., interviews, documents) and plan transcription.
Step 3: Organize the Data
Data organization involves creating a systematic structure. For survey data, assign each respondent a unique identifier and structure variables into columns. For interviews and observations, transcribe audio recordings verbatim, label transcripts clearly and maintain a coding system for anonymity. Maintain proper file naming, version control and documentation. Use secure storage and ensure data confidentiality.
Step 4: Clean the Data
Data cleaning ensures accuracy and consistency. The National Cancer Institute notes that data cleaning involves fixing or removing inaccurate, duplicated or irrelevant data. Key tasks include:
- Handling missing values. Decide whether to delete cases, impute values or use statistical techniques (e.g., pairwise deletion). Document your approach.
- Removing duplicate entries. Duplicate records distort analysis and must be deleted.
- Checking for inconsistent responses and invalid values. Ensure data adhere to expected ranges and formats.
- Identifying outliers. Use z‑scores or boxplots to detect outliers; decide whether to retain or remove them based on their impact on analysis.
- Correcting wrong data types or coding errors. Ensure variables are correctly coded (e.g., numeric vs. categorical). Keep an original copy of the raw data for reference.
- Anonymizing personal information. Remove identifiable data to protect participants.
Step 5: Code the Data
Quantitative coding: Assign numerical codes to categorical variables. For example, code gender as 1 = male, 2 = female (or another scheme consistent with your study). Code Likert responses (e.g., 1 = strongly disagree to 5 = strongly agree). Create a codebook documenting how each variable is coded.
Qualitative coding: Coding involves labeling segments of text with meaningful tags. Braun and Clarke define thematic analysis as identifying, analyzing and reporting patterns (themes) within data. Their six‑phase process includes familiarization, generating initial codes, searching for themes, reviewing themes, defining and naming themes, and producing the report. During open coding, assign codes to all potential elements of interest. Later, group related codes into categories (axial coding) and develop themes (selective coding). Use software like NVivo or ATLAS.ti to assist with coding, or code manually.
Step 6: Choose the Right Analysis Method
Select methods that match your research questions, data type and assumptions. For quantitative data, choose between parametric and non‑parametric tests based on assumptions (normality, homogeneity of variance, independence) (Guetterman, 2019). For qualitative data, decide whether to use thematic analysis, content analysis, narrative analysis, grounded theory, or other methods. Mixed‑methods studies require separate analyses and integration.
Step 7: Select the Right Data Analysis Tool
Tools vary by complexity and data type. Common options include:
- Excel: Suitable for basic descriptive statistics and simple charts; widely accessible but limited for complex analyses.
- SPSS: User‑friendly interface for descriptive and inferential statistics; widely used in social sciences.
- Stata: Powerful for econometrics and advanced statistics.
- R: Free, open‑source programming language; flexible for statistics and graphics but requires coding skills.
- Python: Free language with libraries like pandas, NumPy, SciPy and statsmodels for data manipulation and analysis.
- Jamovi/JASP: Open‑source interfaces offering intuitive access to common statistical tests.
- NVivo, ATLAS.ti, MAXQDA: Specialized software for qualitative coding and analysis.
- Power BI/Tableau: Business‑intelligence tools for interactive data visualization.
Choose a tool based on your skill level, available resources, project complexity and institutional requirements.
Step 8: Run the Analysis
Quantitative analysis:
- Descriptive statistics. Calculate measures of central tendency (mean, median, mode) and variability (variance, standard deviation, range). Use frequencies and percentages for categorical variables.
- Reliability analysis. For scales or questionnaires, compute Cronbach’s alpha to assess internal consistency. Cronbach’s alpha measures how closely related items are; coefficients between 0.65 and 0.8 are generally acceptable.
- Assumption testing. Test for normality (e.g., Shapiro–Wilk test), homogeneity of variance (Levene’s test), linearity and independence of observations. Violated assumptions may require non‑parametric tests.
- Inferential statistics. Choose appropriate tests (see Table 3 below) to examine differences or relationships.
- Regression or advanced modelling. Use regression (linear, multiple, logistic) to predict outcomes.
Qualitative analysis:
- Read and reread transcripts, making initial notes.
- Apply open coding to identify meaningful segments, then group codes into categories and themes.
- Theme development and review. Identify patterns, refine themes and ensure they accurately represent the data.
- Describe how themes answer the research questions and relate to the literature.
- Ensure trustworthiness. Use strategies such as triangulation, member checking, thick description and audit trails to enhance credibility, transferability, dependability and confirmability (Korstjens & Moser, 2018).
Mixed‑methods analysis: Analyze quantitative and qualitative data separately, compare findings, and integrate them through joint displays or narrative integration. Triangulation strengthens conclusions.
Step 9: Interpret the Results
When interpreting your results, think about how they might inform evidence‑based practice in nursing. Applying findings to practice helps bridge the gap between research and patient care.
Interpretation goes beyond describing numbers or themes; it explains what the results mean in relation to the research question. For quantitative results, report the statistic (e.g., t value), p value or confidence interval, effect size and direction of the effect. Note whether differences are statistically significant and whether they are practically meaningful. For correlations, interpret the strength and direction of the relationship (Guetterman, 2019).
For qualitative results, interpret themes by explaining how they answer the research questions. Describe patterns, contradictions and unique insights. Use participant quotes judiciously to illustrate points. Consider how your positionality influences interpretation and acknowledge limitations.
Step 10: Present the Findings
Present results clearly and logically. For quantitative findings:
- Organize the results chapter by research questions or hypotheses.
- Use tables and figures to present descriptive and inferential statistics. Avoid duplicating information across text and tables.
- Report statistics using APA or your discipline’s style (e.g., t(df) = value, p= value). Provide effect sizes and confidence intervals.
- Use appropriate charts: bar charts for categorical comparisons, histograms for distributions, boxplots for variability, scatterplots for relationships.
For qualitative findings:
- Structure the results by themes and subthemes.
- Provide a narrative description of each theme, supported by participant quotes.
- Include visual aids like thematic maps or tables summarizing codes and themes.
Ensure that results are presented separately from discussion unless the journal allows integration.
Step 11: Connect Findings Back to the Literature
Creating a comprehensive nursing literature review will help you situate your findings within existing scholarship and identify gaps for future research.
In the discussion section, relate your findings to previous studies and theories. Explain whether your results support or contradict existing literature. For quantitative studies, discuss implications of significant or non‑significant findings, and mention any limitations (e.g., sample size, violated assumptions). In qualitative studies, discuss how themes relate to prior research and theory. For mixed‑methods studies, integrate insights from both data types. Highlight contributions to knowledge and practical implications.
How to Analyze Quantitative Research Data
This section provides detailed guidance on quantitative analysis. The process includes descriptive statistics, visualization, reliability analysis, assumption testing and inferential statistics.
Descriptive Statistics
Descriptive statistics summarize the central tendency and variability of each variable. According to Guetterman, typical measures of central tendency include the mean, median and mode, while measures of variability include variance, standard deviation and range. Frequencies describe how often each categorical value occurs. Use descriptive statistics to understand your sample and check for errors or outliers.
Data Visualization
Visualization helps reveal patterns. Use bar charts or pie charts for categorical data, histograms for distributions, line graphs for trends over time, boxplots for variability, and scatterplots for relationships. Ensure charts have clear labels and legends. Avoid 3D effects and clutter.
Reliability Analysis
When using a multi‑item scale (e.g., Likert‑type questionnaire), assess internal consistency with Cronbach’s alpha. Cronbach’s alpha measures how closely related items are; values between 0.65 and 0.8 are generally acceptable, while values below 0.5 are unacceptable. Interpret alpha with caution: a very high value (>0.9) may indicate redundancy among items.
Assumption Testing
Parametric tests require assumptions such as normality, homogeneity of variance, linearity and independence of observations. Use tests like Shapiro–Wilk or Kolmogorov–Smirnov for normality, Levene’s test for homogeneity and scatterplots for linearity. If assumptions are violated, consider non‑parametric alternatives.
Inferential Statistics
Inferential tests determine whether observed differences or relationships are statistically significant. The table below summarises common tests.
Table 1. Common inferential tests
| Test | Purpose | Variables required | Example question |
| Independent samples t‑test | Compare means of two independent groups | One categorical IV (two groups), one continuous DV | Do men and women differ in stress scores? |
| Paired samples t‑test | Compare means of two related measurements | One categorical IV (paired), one continuous DV | Do pre‑test and post‑test scores differ? |
| One‑way ANOVA | Compare means of three or more groups | One categorical IV (≥3 groups), one continuous DV | Do stress levels differ across four departments? |
| Repeated measures ANOVA | Compare repeated measurements on the same individuals | One categorical IV (time), one continuous DV | Does anxiety change over three time points? |
| Chi‑square test | Test association between two categorical variables | Two categorical variables | Is educational level associated with employment status? |
| Pearson correlation | Measure linear relationship between two continuous variables | Two continuous variables | Is there a relationship between study time and GPA? |
| Spearman correlation | Correlation for ordinal or non‑normal data | Two ordinal or non‑normal variables | Is there a monotonic relationship between satisfaction and income? |
| Simple linear regression | Predict one continuous outcome from one predictor | One continuous IV, one continuous DV | How does hours of study predict exam score? |
| Multiple regression | Predict an outcome from multiple predictors | Several IVs, one continuous DV | Which factors predict job satisfaction? |
| Logistic regression | Predict a binary outcome | Continuous or categorical IVs, binary DV | What factors predict whether patients adhere to treatment? |
| Mann‑Whitney U test | Non‑parametric alternative to independent t‑test | One categorical IV, one ordinal/continuous DV | Do pain scores differ between two groups when data are not normally distributed? |
| Wilcoxon signed‑rank test | Non‑parametric alternative to paired t‑test | Paired ordinal/continuous data | Do pre‑ and post‑intervention scores differ when data are not normally distributed? |
| Kruskal–Wallis test | Non‑parametric alternative to one‑way ANOVA | One categorical IV, one ordinal/continuous DV | Are satisfaction scores different across three groups with skewed data? |
When reporting results, provide the test statistic (e.g., t, F, χ²), degrees of freedom, p value, confidence interval and effect size. Interpret both statistical and practical significance.
How to Analyze Qualitative Research Data
Qualitative analysis is iterative and interpretative. It involves familiarizing yourself with the data, coding, theme development and ensuring trustworthiness.
Familiarization and Transcription
Start by transcribing interviews verbatim, including pauses and non‑verbal cues if relevant. Read transcripts multiple times to immerse yourself in the data. Note initial impressions and ideas.
Coding
Coding is the process of labeling meaningful segments of text. Braun and Clarke’s six‑phase framework is widely used for thematic analysis:
- Familiarization: Read transcripts repeatedly and take notes.
- Generating initial codes: Identify interesting features of the data; codes are the smallest meaningful units.
- Searching for themes: Group similar codes into categories and look for overarching themes.
- Reviewing themes: Check whether themes accurately represent the coded data and the overall dataset.
- Defining and naming themes: Provide clear definitions and names that reflect the essence of each theme (Fleming, 2023).
- Producing the report: Select vivid quotes, relate themes to research questions and interpret findings.
Use software such as NVivo, ATLAS.ti or MAXQDA to manage coding, or code manually. Maintain a codebook documenting each code, its definition and example excerpts.
Example of Coding
Suppose an interview participant says: “I found that group study sessions helped me feel less isolated and more motivated.” A possible coding path might be:
| Raw statement | Code | Category | Theme |
| “Group study sessions helped me feel less isolated” | Support from peers | Social support | Community and belonging |
| “Group study sessions helped me feel…more motivated” | Increased motivation | Motivation | Engagement and motivation |
By grouping codes, you identify categories (e.g., social support, motivation) which then form themes (e.g., Community and belonging, Engagement and motivation).
Trustworthiness in Qualitative Analysis
Quality criteria for qualitative research include credibility, transferability, dependability, confirmability and reflexivity. Strategies to enhance trustworthiness include:
- Prolonged engagement and persistent observation: Spending sufficient time in the field to understand the context.
- Triangulation: Using multiple data sources, investigators or methods to cross‑validate findings(Korstjens & Moser, 2018).
- Member checking: Returning findings to participants for feedback and confirmation.
- Thick description: Providing detailed contextual information to allow readers to judge transferability.
- Audit trail: Documenting every step of the research process for dependability and confirmability.
- Reflexive journaling: Reflecting on your positionality and potential biases.
How to Analyze Mixed‑Methods Research Data
Mixed‑methods analysis integrates quantitative and qualitative evidence. The process generally includes:
- Separate analyses. Analyze quantitative and qualitative data independently using appropriate methods (e.g., inferential statistics and thematic analysis).
- Comparison of findings. Compare results to see whether they converge or diverge. Use matrices or joint displays to show how themes and statistics relate.
- Integrate findings by explaining quantitative results with qualitative insights or expanding quantitative findings with qualitative detail. For example, survey results showing high satisfaction can be enriched by interview data explaining why participants felt satisfied.
- Use triangulation to validate findings across methods.
Example
Imagine a study examining the impact of peer mentoring on student retention. Researchers collect survey data measuring sense of belonging (quantitative) and conduct interviews exploring mentoring experiences (qualitative). After analyzing both datasets separately, they discover that students with high belonging scores also describe feeling supported and motivated. Integrating these findings provides a richer understanding of how peer mentoring affects retention.
Choosing the Right Research Data Analysis Method
Selecting the appropriate analysis method can be challenging. Use the table below to match research aims with suitable methods and software.
Table 2. Choosing an analysis method
| Research aim | Data type | Variables | Recommended analysis | Suitable software | Example output |
| Describe a sample | Quantitative | Continuous/categorical | Descriptive statistics | Excel, SPSS, R | Means, SDs, frequencies |
| Compare two groups | Quantitative | Categorical IV (2 levels), continuous DV | Independent t‑test or Mann‑Whitney U | SPSS, Stata, jamovi | t value, p value, effect size |
| Compare three or more groups | Quantitative | Categorical IV (≥3), continuous DV | One‑way ANOVA or Kruskal–Wallis | SPSS, R, Python | F statistic, p value, post hoc tests |
| Test a relationship | Quantitative | Continuous variables | Pearson or Spearman correlation | SPSS, R, Python | Correlation coefficient (r), p value |
| Predict an outcome | Quantitative | Continuous/categorical | Regression analysis (linear, multiple, logistic) | SPSS, Stata, R, Python | Regression coefficients, model fit (R², AIC) |
| Analyze interview responses | Qualitative | Coded text | Thematic analysis, content analysis | NVivo, ATLAS.ti, MAXQDA | Themes, narrative descriptions |
| Identify themes | Qualitative | Coded text | Thematic or grounded theory analysis | NVivo, ATLAS.ti | Themes, subthemes |
| Analyze open‑ended survey responses | Qualitative | Coded text | Content analysis | NVivo, Excel, Python | Frequency of codes, themes |
| Combine survey and interview findings | Mixed | Quantitative & qualitative | Mixed‑methods integration | NVivo, R, Excel | Joint displays, narrative integration |
Best Tools for Research Data Analysis
Different tools suit different skills and purposes. The table below compares popular options.
Table 3. Comparison of data analysis tools
| Tool | Best for | Skill level | Strengths | Limitations |
| Excel | Basic descriptive statistics, simple charts | Beginner | Easy to learn; widely available; good for data entry | Limited advanced statistics; prone to errors with large datasets |
| SPSS | Social science statistics | Beginner–Intermediate | User‑friendly interface; broad range of statistical tests; good documentation | Expensive; limited customization; primarily GUI based |
| Stata | Econometrics and longitudinal analysis | Intermediate | Powerful for panel data and advanced models; good documentation | Costly; command syntax required for advanced features |
| R | Advanced statistics, graphics | Intermediate–Advanced | Free and open source; extensive packages; flexible | Steeper learning curve; requires coding |
| Python | Data manipulation, machine learning | Intermediate–Advanced | Free; versatile libraries (pandas, SciPy, statsmodels); integration with machine learning | Requires programming knowledge; packages vary in maturity |
| Jamovi/JASP | Intuitive statistical analysis | Beginner | Free; simple interface; replicates SPSS outputs | Limited range of advanced analyses |
| NVivo | Qualitative coding | Beginner–Intermediate | Powerful for large qualitative datasets; supports multimedia data | Expensive; learning curve |
| ATLAS.ti | Qualitative coding | Intermediate | Flexible coding and memoing; supports network views | Costly; interface may be less intuitive |
| MAXQDA | Qualitative and mixed‑methods analysis | Beginner–Intermediate | Mixed‑methods features; intuitive interface | Expensive; limited advanced quantitative statistics |
| Power BI/Tableau | Data visualization and dashboards | Beginner–Intermediate | Interactive, attractive visualizations; integration with databases | Not designed for complex statistical analysis |
When selecting a tool, consider factors such as budget, learning curve, required analyses and institutional availability. For example, SPSS and NVivo are common in social sciences, while R and Python are favoured in data science.
How to Interpret Research Data Analysis Results
Quantitative Interpretation
When interpreting statistical results, consider several elements:
- P‑value and significance. The p‑value indicates the probability of observing the effect if the null hypothesis is true. A low p (<0.05) suggests statistical significance, but this threshold is arbitrary; consider the context and sample size.
- Confidence intervals (CI). CIs provide a range of plausible values for population parameters. Narrow intervals indicate precise estimates.
- Effect size. Measures such as Cohen’s d, η² or odds ratio quantify the magnitude of the effect independent of sample size.
- Direction and strength. Correlation coefficients reveal whether relationships are positive or negative and how strong they are.
- Model fit. For regression models, examine R² (proportion of variance explained) and diagnostics (e.g., residual plots).
Always interpret statistical significance alongside practical significance. A small p‑value may reflect a trivial effect in a large sample, while a marginally non‑significant result may still have practical relevance.
Qualitative Interpretation
Qualitative interpretation involves explaining what themes mean in relation to the research questions. Consider how themes interrelate, where they converge or diverge, and what surprises emerge. Use participant quotes judiciously to illustrate points. Reflect on your positionality and potential biases. Situate your interpretation within existing literature and theory.
How to Present Research Data Analysis Findings
Results Chapter Structure
- Introduction to results. Briefly remind readers of the research questions and describe the structure of the chapter.
- Descriptive statistics and sample characteristics. Present tables summarizing demographic variables and key measures.
- Inferential results. Organize by research question or hypothesis. For each test, report the statistic, degrees of freedom, p‑value, effect size and interpretation.
- Qualitative themes. Present each theme with a clear heading, narrative explanation and supporting quotes. Avoid mixing results and discussion.
- Mixed‑methods integration. Use joint displays or narrative to integrate quantitative and qualitative findings.
Tables, Graphs and Figures
Use tables to present numerical results concisely. Charts should be clear and labelled. Avoid duplicating information across text and tables. For example, an APA‑style t‑test result might read: t(58) = 2.45, p = 0.017, d = 0.32. Qualitative themes can be summarized in a table listing themes, subthemes and illustrative quotes.
Common Mistakes When Analyzing Research Data
Avoid these pitfalls:
- Ignoring research questions. Analysis should be driven by questions; do not explore data aimlessly.
- Using the wrong statistical test. Ensure that assumptions are met and variables suit the chosen test (Guetterman, 2019).
- Neglecting data cleaning. Inaccurate or duplicated data can skew results.
- Treating Likert data incorrectly. Treat ordinal data cautiously; use medians and appropriate non‑parametric tests when necessary.
- Misinterpreting p‑values. A significant p‑value does not imply a large or important effect; consider effect size.
- Ignoring qualitative trustworthiness. Failure to ensure credibility, transferability, dependability and confirmability undermines qualitative findings.
- Overgeneralizing findings. Do not extrapolate beyond the sample or context; discuss limitations.
- Mixing results and discussion. Keep interpretation in the discussion section unless otherwise required.
- Using software blindly. Understand the methods behind software outputs; do not rely solely on default settings.
- Failing to link findings to objectives. Connect results back to research aims and literature.
Practical Example: From Raw Data to Findings
Research Scenario
Topic: The impact of peer support on first‑year nursing students’ stress and sense of belonging.
Aim: To determine whether participation in peer support groups reduces stress and increases sense of belonging among first‑year nursing students.
Research questions:
- Do students participating in peer support groups report lower stress levels than non‑participants?
- Does participation increase students’ sense of belonging?
- How do students describe their experiences of peer support?
Data:
- Quantitative: Pre‑ and post‑intervention surveys measuring stress (continuous variable) and belonging (continuous variable) using validated scales. Participants (n = 60) are randomly assigned to intervention and control groups.
- Qualitative: Post‑intervention focus group discussions with intervention participants.
Data Cleaning and Organization
- Enter survey responses into a spreadsheet. Assign each participant a unique ID.
- Check for missing values and outliers. Replace missing items using mean substitution (if <5 % missing) and remove three extreme outliers after verifying data entry errors.
- Transcribe focus group audio recordings verbatim. Remove identifying details.
Analysis Method
- Quantitative: Use paired samples t‑tests to compare pre‑ and post‑stress scores within each group. Use independent samples t‑tests to compare post‑scores between groups. Compute Cronbach’s alpha for each scale (stress scale α = 0.82; belonging scale α = 0.79).
- Qualitative: Conduct thematic analysis following Braun and Clarke’s framework (Fleming, 2023). During coding, identify themes such as Community support, Shared understanding and Motivational boost.
Example Output
- t(29) = 2.76, p= 0.009, d = 0.50; intervention group’s stress decreased significantly more than control. Belonging scores increased significantly (t(29) = 3.12, p = 0.004, d = 0.57).
- Qualitative themes reveal that students felt “less isolated,” “encouraged by peers,” and “more confident” after participating.
Interpretation and Presentation
- Present mean stress and belonging scores in tables. Include effect sizes and confidence intervals.
- In the qualitative results section, describe themes with illustrative quotes. For example, “I realised I’m not alone in feeling overwhelmed” (Participant 4).
- In the discussion, integrate quantitative and qualitative findings: decreased stress scores align with themes of emotional support and shared experiences.
Research Data Analysis Checklist
Use this checklist to ensure your analysis is complete.
Table 4. Research data analysis checklist
| Stage | Checklist items |
| Before analysis | • Review research questions and objectives. • Confirm data type and level of measurement. • Organize data files and create backups. • Clean data for missing values, duplicates and outliers. • Label variables and create a codebook. |
| During analysis | • Compute descriptive statistics and visualize data. • Test assumptions (normality, homogeneity). • Choose appropriate statistical tests or qualitative methods. • Code qualitative data systematically. • Save analysis scripts or software outputs. |
| After analysis | • Interpret findings (quantitative: p‑values, effect sizes; qualitative: themes and patterns). • Prepare tables, graphs and narrative descriptions. • Check APA or relevant reporting style. • Link results back to research objectives and literature. • Identify limitations and consider further research. |
When to Seek Research Data Analysis Help
While this guide equips you with essential skills, there are times when consulting an expert is prudent. Seek help when:
- You are uncertain about which statistical test or qualitative method to use.
- You encounter complex datasets with missing values or errors.
- You need assistance interpreting SPSS, R, Excel, Stata, NVivo or Python outputs.
- Your supervisor requests major changes to your analysis or results chapter.
- You must prepare tables, graphs or qualitative themes under tight deadlines.
Professional support can help you choose the right analysis method, interpret results accurately and present findings clearly. However, consulting an expert should complement your learning, not replace your ethical responsibility to understand your data.
If the analysis process seems overwhelming or you need personalized guidance, consider seeking nursing dissertation help to support your research journey.
FAQs
Below are common questions about analyzing research data. Each answer is concise and practical.
1. How do you start analyzing research data?
Begin by reviewing your research questions and objectives. Identify the type of data collected, organize it into an analyzable format and perform thorough data cleaning to address missing values, duplicates and outliers(Cleaning Data, 2025). For quantitative data, compute descriptive statistics and test assumptions before choosing inferential tests. For qualitative data, transcribe and familiarize yourself with the content before coding. Always align analysis with the research aims.
2. What is the first step in research data analysis?
The first step is understanding your research design and clarifying the questions you want to answer. This guides the choice of analysis method and software. Once your questions are clear, categorize your data (quantitative or qualitative), organize it systematically and ensure that you maintain the integrity of the raw data for reference.
3. What is the best method for analyzing research data?
There is no single “best” method; it depends on your research questions, data type and assumptions. Quantitative questions often require inferential tests like t‑tests, ANOVA, correlation or regression. Qualitative questions may call for thematic analysis or grounded theory. Mixed‑methods studies use a combination of both. Select the method that directly addresses your research objectives.
4. How do you analyze quantitative research data?
Analyze quantitative data by computing descriptive statistics to understand central tendencies and variability (Guetterman, 2019) . Then test assumptions and choose appropriate inferential tests (e.g., t‑tests, ANOVA, correlation, regression) to examine differences or relationships. Use software like SPSS, R or Python. Report test statistics, p‑values, confidence intervals and effect sizes. Interpret results in relation to your research questions.
5. How do you analyze qualitative research data?
Qualitative analysis involves familiarization, coding, theme development and interpretation. Transcribe interviews or discussions, read transcripts repeatedly and generate initial codes. Group codes into themes and refine them. Use strategies like triangulation and member checking to ensure credibility and dependability. Present themes with illustrative quotes and discuss how they answer the research questions.
6. How do you analyze survey data for research?
Survey data usually contain both categorical and continuous variables. Start by cleaning and coding responses, ensuring missing values and outliers are handled. Use descriptive statistics to summarize responses and visualize distributions. Depending on your questions, apply inferential tests such as chi‑square for associations, t‑tests or ANOVA for group differences, and regression for predictions. Consider reliability analysis (e.g., Cronbach’s alpha) for multi‑item scales(Goforth, 2015).
7. How do you analyze interview data?
Transcribe the interviews verbatim, then read the transcripts to familiarize yourself with the data. Use open coding to label meaningful segments, then group codes into categories and themes. Follow thematic analysis steps or grounded theory procedures. Use qualitative software (NVivo, ATLAS.ti) or manual coding. Employ strategies like triangulation, member checking and reflexive journaling to ensure trustworthiness.
8. What software is best for research data analysis?
It depends on your data and skill level. SPSS is user‑friendly for social sciences and basic statistics, while R and Python offer flexibility for advanced analyses but require coding. Stata is powerful for econometrics and panel data. NVivo, ATLAS.ti and MAXQDA support qualitative coding. Tools like Jamovi and JASP provide free, intuitive interfaces. Choose software based on your project needs, institutional resources and personal proficiency.
9. How do you choose the right statistical test?
Consider the number of variables, their measurement levels and your research question. If comparing two independent means, use an independent samples t‑test; for paired observations, use a paired samples t‑test. For three or more groups, use ANOVA. Use correlation or regression for relationships and logistic regression for binary outcomes. If assumptions are violated, choose non‑parametric alternatives such as Mann‑Whitney U or Kruskal–Wallis tests.
10. What is the difference between data analysis and data interpretation?
Data analysis refers to processing data using statistical or qualitative methods to produce results (e.g., mean scores, themes). Data interpretation is the process of explaining what those results mean in relation to the research questions. For example, analysis might show a significant difference between groups, while interpretation explains why that difference matters and how it relates to theory and practice. Interpretation integrates results with context, literature and practical implications (Guetterman, 2019).
11. Can Excel be used to analyze research data?
Excel is suitable for basic descriptive statistics, simple charts and initial data cleaning. It is accessible and easy to use, making it useful for small projects or quick summaries. However, Excel has limitations for advanced statistical tests and lacks reproducibility features. For inferential statistics or large datasets, consider specialized software like SPSS, R, Python, Stata or Jamovi. You can still use Excel for data entry and visualization before exporting to other software.
12. How do you present research data analysis in a dissertation?
In a dissertation, dedicate a results chapter that begins with a brief introduction reminding readers of the research questions. Present descriptive statistics, then inferential results organized by hypothesis. Use tables and graphs to summarize data, following the required citation style. For qualitative data, describe each theme with headings and supporting quotes. Avoid mixing results and interpretation; save discussion for a separate chapter. Ensure that tables and figures are numbered, titled and referenced within the text.
Conclusion
Understanding how to analyze research data is essential for producing credible, evidence‑based findings. The process begins with clarifying your research questions, identifying your data type and carefully organizing and cleaning your data. Quantitative analysis involves descriptive statistics, assumption testing, inferential tests and interpretation of p‑values, effect sizes and confidence intervals. Qualitative analysis requires meticulous coding, theme development and strategies to ensure trustworthiness. Mixed‑methods analysis combines both approaches and integrates findings through triangulation. Proper presentation of results in tables, graphs and narrative form, and linking findings back to the literature, enhance the impact of your research. By following the step‑by‑step guidance in this article, students and professionals can confidently move from raw data to meaningful conclusions.
References
Braun, V., & Clarke, V. (2006). Using thematic analysis in psychology. Qualitative Research in Psychology, 3(2), 77–101. https://doi.org/10.1191/1478088706qp063oa
Cleaning data. (2025, September 3). Cancer.gov. https://www.cancer.gov/about-nci/organization/cbiit/training/learn/clean
Fleming, C. E. (2023, July 18). Qualitative methods for the quantitatively inclined. Center for Engaged Learning. https://www.centerforengagedlearning.org/qualitative-methods-for-the-quantitatively-inclined/
Goforth, C. (2015, November 16). Using and interpreting Cronbach’s alpha. University of Virginia Library. https://library.virginia.edu/data/articles/using-and-interpreting-cronbachs-alpha
Guetterman, T. C. (2019). Basics of statistics for primary care research. Family Medicine and Community Health, 7(2), e000067. https://doi.org/10.1136/fmch-2018-000067
Korstjens, I., & Moser, A. (2018). Series: Practical guidance to qualitative research. Part 4: Trustworthiness and publishing. European Journal of General Practice, 24(1), 120–124. https://doi.org/10.1080/13814788.2017.1375092
Northern Illinois University. (2025). Data analysis. Responsible Conduct in Data Management. https://ori.hhs.gov/education/products/n_illinois_u/datamanagement/datopic.html
