

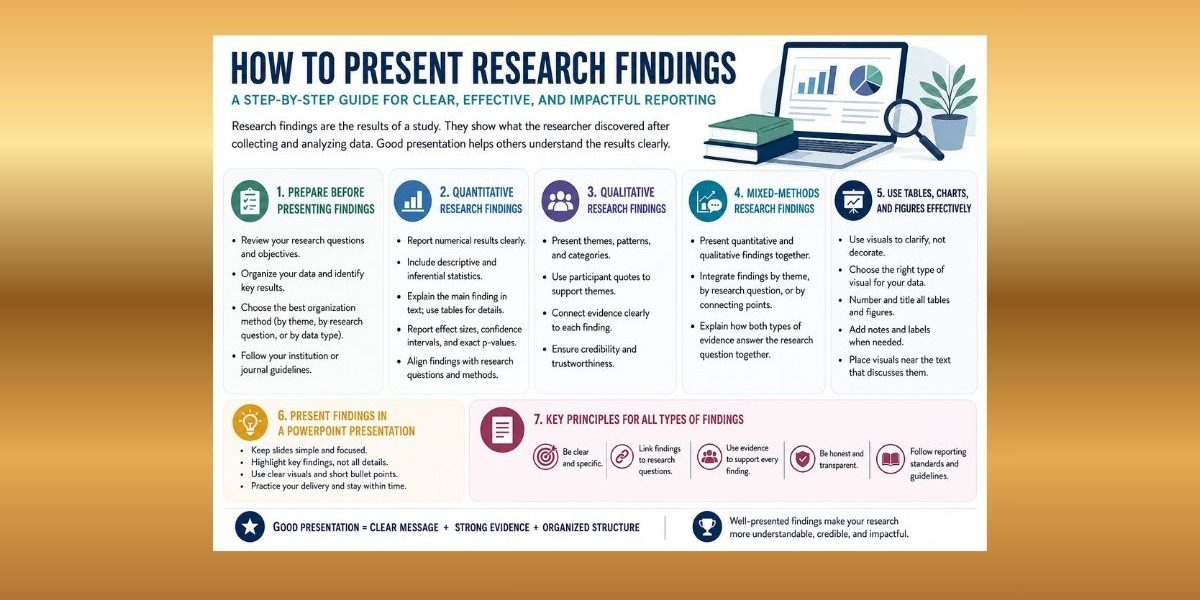
Clear findings presentation helps readers understand what your study discovered without forcing them to work through raw data, scattered statistics, or disconnected participant quotes. Whether you are writing a dissertation, thesis, research paper, report, viva slides, or PowerPoint presentation, your findings should connect directly to your research questions, objectives, hypotheses, or themes.
Good presentation does not mean adding every number, quote, table, or graph from your analysis. It means selecting the findings that answer the study’s purpose and arranging them in a logical, evidence-based order. A strong findings section shows what the data revealed, supports each point with appropriate evidence, and prepares the reader for deeper interpretation in the discussion.
This guide explains how to present research findings in academic writing and presentations, including quantitative, qualitative, and mixed-methods findings. It also shows how to use tables, charts, figures, and examples without overwhelming your reader.
What Are Research Findings?
Research findings are the key outcomes that emerge from your data after analysis. They show what the evidence revealed in relation to your research questions, objectives, hypotheses, or themes. In simple terms, findings answer the question: What did the study find?
Findings are closely related to results, but they are not the same as raw data, data analysis, discussion, or conclusion. Data analysis is the process used to examine the data. Results or findings are the outcomes of that process. The discussion explains what those outcomes mean in relation to previous studies, theory, context, and the research problem.
| Section | Main Purpose | What It Includes |
|---|---|---|
| Data analysis | Explains how data were examined | Statistical tests, coding, categorization, theme development, or analytical procedures |
| Findings/results | Presents what the data revealed | Tables, figures, statistics, themes, quotes, and patterns |
| Discussion | Explains what the findings mean | Interpretation, comparison with literature, implications, limitations |
| Conclusion | Summarizes the study’s contribution | Main takeaway, recommendations, and final statement |
In most dissertations and theses, findings and discussion may be separate chapters. In some qualitative, mixed-methods, or professional research formats, findings and discussion may be integrated, but the reader should still be able to distinguish between evidence and interpretation.
How to Prepare Before Presenting Research Findings
Strong presentation begins before writing. Before you create a findings chapter, results section, report, or slide deck, you need to decide which findings matter, how they should be organized, and what format will make them easiest to understand.
Revisit the Research Questions or Objectives
Start by returning to your research questions, objectives, hypotheses, or themes. Each finding should serve a clear purpose. If a result does not help answer the study’s central questions, it probably does not belong in the main findings section.
For example, a survey study on student satisfaction may collect demographic data, course ratings, attendance patterns, and open-ended comments. However, if the research question focuses on factors influencing satisfaction, the findings should prioritize the variables or themes that directly explain satisfaction.
This is also where students often benefit from dissertation data analysis help if they are unsure whether their analysis outputs match their research questions.
Select the Most Relevant Findings
You do not need to present everything produced during analysis. Strong findings presentation requires selection. Remove irrelevant statistics, unrelated quotes, excessive raw data, and background details that do not support the research purpose.
Relevant findings usually do one or more of the following:
Answer a research question or objective.
Support or challenge a hypothesis.
Show a meaningful trend, relationship, difference, theme, or pattern.
Explain an important part of the research problem.
Highlight an unexpected result that deserves attention.
A findings section becomes weak when it reads like a data dump. Readers need a guided presentation, not every output from SPSS, Excel, NVivo, R, Stata, or manual coding.
Choose the Best Organization Method
There is no single correct structure for presenting research findings. The best method depends on your study design, research questions, and institutional guidelines. Because qualitative, quantitative, and mixed-methods studies organize evidence differently, the presentation of findings should match the research design and the purpose of the study (Creswell & Creswell, 2023).
Common organization methods include:
| Organization Method | Best Used When |
|---|---|
| By research question | The study has clear questions that guide the analysis |
| By objective | The dissertation or report is structured around objectives |
| By hypothesis | The study uses statistical testing |
| By theme | The study is qualitative or thematic |
| By variable | The study compares several measurable variables |
| By participant group | Findings differ across groups, such as students, nurses, managers, or patients |
| By case | The research uses case study design |
| Chronological order | Findings follow a process, timeline, intervention, or sequence |
For most student projects, organizing findings by research question, objective, hypothesis, or theme is usually the clearest option.
Decide the Best Presentation Format
Findings can be presented through narrative text, tables, charts, graphs, participant quotes, models, or a combination of formats. The format should improve clarity rather than decorate the section.
Make use of narrative text to explain the main finding. Use tables when readers need detailed numerical results or categorized summaries. Use charts when trends, comparisons, or patterns are easier to see visually. Ensure that also, you make use of participant quotes when qualitative evidence needs the participant’s voice. APA guidance emphasizes that tables and figures should support understanding, not duplicate text unnecessarily.
How to Present Research Findings Step by Step
A clear findings section follows a logical process. The goal is to help readers move from the research question to the evidence without confusion.
Start with the research question, objective, hypothesis, or theme. This signals what the section will answer.
Present the most important finding first. Do not hide the main result behind minor details.
Summarize the finding before giving detailed evidence. A short topic sentence helps readers understand the point before they see statistics, quotes, or tables.
Use clear academic language. Avoid vague phrases such as “many people said” or “the results were interesting.” Be specific.
Use tables, figures, graphs, or quotes only where they improve clarity. A table should not repeat everything already explained in the paragraph.
Explain what each visual shows. Do not insert a table or figure and expect the reader to interpret it alone.
Avoid repeating every number from a table in paragraph form. Report the most important values in the text and leave detailed figures in the table.
Keep findings separate from deeper discussion unless your format requires integration. In many dissertations, the findings chapter presents evidence, while the discussion chapter interprets it.
Link each finding back to the purpose of the study. This keeps the section focused.
End each section with a clear transition. A brief closing sentence can prepare the reader for the next research question, theme, or result.
Weak and Strong Findings Presentation Example
Weak version:
The table shows the results for satisfaction. There were many responses. Some students were satisfied and some were not. The mean was 3.8, and the standard deviation was 0.74. The p-value was 0.02.
Stronger version:
Students reported moderately high satisfaction with online academic support. The mean satisfaction score was 3.80 on a five-point scale, suggesting that most respondents evaluated the support positively. The relationship between frequency of support use and satisfaction was statistically significant, indicating that students who used the service more often tended to report higher satisfaction.
The stronger version explains the finding before mentioning the evidence. It does not simply list numbers. It tells the reader what the result shows.
How to Present Quantitative Research Findings
Quantitative findings involve numerical results. These may include descriptive statistics, frequencies, percentages, correlations, regression findings, t-tests, ANOVA, chi-square tests, confidence intervals, p-values, effect sizes, and hypothesis testing results. For randomized trials or intervention studies, researchers should also report findings transparently using recognized trial reporting guidance such as CONSORT, especially when presenting participant flow, group comparisons, outcomes, and intervention effects (Schulz et al., 2010).
When presenting quantitative results, the text should explain the main finding, while tables should provide detailed values. Reporting standards for quantitative studies emphasize clear, complete reporting so readers can understand what was tested, what was found, and how strong the evidence is (APA Style JARS, 2020).
What to Include in the Text
In the paragraph, include the finding that directly answers the research question or hypothesis. Mention the most important statistics, but do not overload the sentence with every value from the output.
For example, when reporting survey findings, you might write:
Most respondents agreed that supervisor feedback improved their confidence in completing clinical tasks. Overall, 68% selected “agree” or “strongly agree,” while 14% disagreed. This suggests that feedback was perceived as an important contributor to student confidence.
When reporting correlation findings:
A positive relationship was found between study time and exam performance. Students who reported more weekly study hours tended to achieve higher exam scores, indicating that study time was associated with academic performance.
When reporting regression findings:
The regression analysis showed that customer satisfaction significantly predicted repeat purchase intention after controlling for age and income. This indicates that satisfaction explained unique variation in repeat purchase behavior beyond demographic factors.
When reporting group comparison findings:
Students who attended weekly tutorials had higher mean assessment scores than those who did not attend. The difference suggests that regular tutorial participation may be associated with improved academic performance.
When reporting hypothesis testing findings:
The hypothesis that training participation would improve employee productivity was supported. Employees who completed the training recorded higher productivity scores than those who did not, indicating a statistically significant group difference.
What to Put in Tables
Use tables for detailed descriptive statistics, model summaries, cross-tabulations, regression coefficients, group comparison results, and hypothesis testing outputs. Tables are helpful when readers need exact values, but the paragraph should still identify the main finding.
For students working with statistical outputs, our SPSS data analysis help, will ensure you have it right.
Common Quantitative Findings Mistakes
Avoid reporting p-values without explaining the result. A p-value alone does not tell the reader what happened.
Do not ignore effect size. A statistically significant result may still have a small practical effect.
Avoid repeating the entire table in the text. Summarize the key result instead.
Use consistent decimal places. Reporting one value as 3.2 and another as 3.24891 looks unprofessional unless precision is required.
Remove irrelevant variables. If a variable does not answer the research question, it should not dominate the findings section.
Make sure your findings match the research questions. This is one of the most important checks in quantitative results presentation.
How to Present Qualitative Research Findings
Qualitative findings focus on meaning, experience, perception, behavior, and context. They are usually presented through themes, subthemes, categories, patterns, interview findings, focus group findings, observation findings, document analysis findings, participant quotes, and thematic tables. When reporting interview or focus group findings, researchers should present enough detail about the themes, participant evidence, and reporting process to make the qualitative findings transparent and credible (Tong et al., 2007).
Qualitative findings should be structured clearly so the reader can see how the evidence supports each theme. Qualitative reporting should provide enough detail for readers to understand the research context, analytic process, evidence, and interpretation of themes (Levitt et al., 2018).
Structuring Qualitative Findings
A strong qualitative findings section usually introduces each theme, explains what the theme means, supports the theme with evidence, and links the theme back to the research question.
A simple structure may look like this:
Theme title
Brief explanation of the theme
Evidence from participant quotes or observations
Short interpretation of what the evidence shows
Transition to the next theme
Use short quotes that directly support the point. Do not fill the section with long blocks of participant speech. Too many quotes can make the findings feel unorganized, while too few quotes can make the findings feel unsupported.
Using Participant Quotes
Participant quotes should be relevant, concise, and clearly connected to the theme. Protect confidentiality by using labels such as Participant 1, Nurse 4, Student B, Manager 2, or Interviewee 6. Do not include identifying details unless participants gave permission and the study design allows it.
A good qualitative findings paragraph might read:
Theme 1: Confidence Increased Through Guided Practice
Participants described guided practice as important in building confidence during clinical placement. Several students explained that they felt more prepared when instructors demonstrated procedures before asking them to perform tasks independently. One participant stated, “Watching the procedure first helped me understand what to do before trying it myself” (Participant 3). This theme shows that structured demonstration supported students’ confidence and reduced uncertainty during practical learning.
Credibility and Trustworthiness
Qualitative findings should also show credibility and trustworthiness where relevant. Common trustworthiness concepts include credibility, dependability, confirmability, and transferability. Researchers may support trustworthiness through triangulation, member checking, audit trails, reflexive notes, peer review, or thick description. Lincoln and Guba’s trustworthiness framework remains widely used in qualitative research reporting (Lincoln & Guba, 1985).
How to Present Mixed-Methods Research Findings
Mixed-methods findings combine quantitative and qualitative results in one study. The goal is not simply to place numbers and quotes side by side. The goal is to show how both forms of evidence answer the research question together. Mixed-methods reporting standards recommend explaining clearly how qualitative and quantitative evidence are combined within the study (American Psychological Association, n.d.).
APA’s mixed-methods reporting standards note that mixed-methods studies should clearly explain how qualitative and quantitative approaches are combined. Findings may be presented in several ways.
You can present quantitative findings first and qualitative findings second. This works well in explanatory sequential designs, where qualitative data explains statistical results.
You can present qualitative findings first and quantitative findings second. This works well in exploratory sequential designs, where qualitative findings help shape a later survey or measurement phase.
You can integrate both types of findings by research question. This is useful when each research question has both numerical and narrative evidence.
You can also use joint display tables. A joint display places quantitative results, qualitative themes, and the integrated interpretation in one table.
Mixed-Methods Example
Survey results showed that 72% of nursing students reported moderate to high anxiety before simulation assessment. Interview findings helped explain this pattern, as students described fear of making visible mistakes in front of peers. Together, the findings suggest that assessment anxiety was not only related to task difficulty but also to the social pressure of being observed during clinical simulation.
This example shows how qualitative findings can explain quantitative results.
How to Use Tables, Charts, and Figures
Tables, charts, and figures should make findings easier to understand. They should not be used as decoration. A visual is useful only when it communicates information more clearly than text alone. APA guidance explains that tables and figures should be used to support understanding, organize information clearly, and avoid unnecessary duplication of text (American Psychological Association, n.d.).
APA Style explains that tables typically use rows and columns, while figures include graphs, charts, drawings, photographs, maps, or other visuals.
When to Use Tables
Use tables when you need to present detailed numerical results, comparisons, categories, themes, demographic information, regression outputs, or summary findings. Tables work best when exact values matter.
For example, a table is useful for presenting mean scores by group, participant demographics, hypothesis testing results, or themes with supporting quotes.
When to Use Charts and Graphs
Use charts and graphs when patterns are easier to understand visually.
| Visual Format | Best Used For |
|---|---|
| Bar chart | Comparing categories or groups |
| Pie chart | Showing simple proportions, used sparingly |
| Line graph | Showing change over time |
| Histogram | Showing distribution of a continuous variable |
| Scatterplot | Showing relationships between two variables |
| Box plot | Showing spread, median, and outliers |
| Thematic map | Showing relationships between qualitative themes |
| Conceptual model | Showing how concepts connect |
Avoid overcrowded visuals. A chart with too many categories, colors, labels, or axes can confuse readers instead of helping them.
How to Format Tables and Figures
Every table and figure should have a clear number, title, labels, and notes where needed. Tables and figures should also be formatted consistently so readers can identify the title, number, labels, and explanatory notes without confusion (Purdue Writing Lab, 2022).
For example:
Table 2 summarizes the relationship between study time and exam performance. The results show that students who studied more hours per week generally achieved higher scores.
This explanation tells the reader why the table matters.
How to Present Findings in a Dissertation or Thesis
In a dissertation or thesis, findings are usually presented in a dedicated findings or results chapter. The chapter should be organized around the study’s research questions, objectives, hypotheses, or themes. Students should also follow their course syllabus, dissertation handbook, supervisor instructions, or institutional formatting guide because some programs specify how findings, tables, figures, chapter headings, and submission formats should be presented (Davis, 2025).
A common dissertation findings chapter structure is:
Chapter introduction
Restatement of research questions or objectives
Description of participants or sample
Findings organized by research question, objective, hypothesis, or theme
Tables, charts, quotes, or figures
Summary of key findings
Transition to the discussion chapter
The chapter introduction should briefly remind readers what the study investigated and how the findings are organized. It should not repeat the full methodology chapter. The sample or participant overview should provide enough context for the findings, but not unnecessary background.
For quantitative dissertations, organize findings by hypotheses or research questions. In qualitative dissertations, organize findings by themes or research questions. For mixed-methods dissertations, decide whether separate or integrated presentation best fits the design.
How to Present Research Findings in a Journal Article or Research Paper
In a journal article or research paper, findings are usually presented in the results section. This section is shorter and more selective than a dissertation findings chapter. Journal readers expect concise reporting, alignment with the methods section, and efficient use of tables and figures.
Report only results that answer the research aims, questions, or hypotheses. Avoid explaining implications in detail, because that belongs in the discussion section. Also follow the journal’s formatting rules for tables, figures, headings, statistical reporting, and word count.
Short Results-Section Example
Participants who received structured academic feedback reported higher confidence scores than those who received general comments. The largest difference was observed in students’ confidence in revising research arguments. These findings suggest that feedback specificity was associated with stronger perceived writing confidence.
This example is concise, focused, and appropriate for a research paper results section.
How to Present Research Findings in PowerPoint or Oral Presentations
A research findings presentation should be simpler than a written chapter. In a viva, thesis defense, seminar, class presentation, or conference presentation, your audience cannot process long paragraphs, crowded tables, or complex statistical outputs on slides.
Start with the research question or objective. Present only the most important findings. Use simple visuals, readable charts, and short slide text. Explain the findings verbally instead of reading from the slide.
Each findings slide should have one key takeaway. Speaker notes can help you remember details without overloading the slide.
A sample slide sequence may include:
Study title
Research problem
Research questions or objectives
Methods summary
Participant or sample overview
Key quantitative findings
Key qualitative findings
Visual summary of findings
Discussion preview
Conclusion and recommendations
For a research findings presentation, use charts and tables carefully. A slide should guide the audience, not force them to analyze a full dissertation table in real time.
Examples of How to Write Research Findings
Quantitative Survey Findings
Most respondents reported that online tutoring improved their understanding of course content. Specifically, 74% agreed or strongly agreed that tutoring sessions helped them complete assignments more confidently. This finding suggests that structured academic support was perceived as useful by most participants.
Correlation Findings
A positive relationship was found between weekly study time and final examination score. Students who reported higher study hours generally achieved higher scores, indicating that study time was associated with academic performance.
Regression Findings
Customer satisfaction significantly predicted repeat purchase intention after controlling for age, income, and purchase frequency. This finding indicates that satisfaction was an important predictor of future buying behavior in the sample.
Qualitative Interview Findings
Participants described workload pressure as a major barrier to completing research tasks. Several students explained that competing deadlines made it difficult to maintain consistent progress. One participant stated, “I understood what I needed to do, but I kept postponing because other assignments came first” (Participant 5).
Thematic Analysis Findings
The first theme, limited confidence with statistical interpretation, reflected students’ difficulty explaining numerical outputs in academic language. Participants were often able to generate tables but struggled to describe what the results meant in relation to their research questions.
Mixed-Methods Findings
Survey findings showed that 63% of employees preferred flexible work arrangements. Interview findings explained this preference by showing that flexibility helped employees manage commuting time, family responsibilities, and concentration. Together, the findings suggest that flexible work was valued for both practical and wellbeing-related reasons.
Dissertation Findings Chapter
Research Question 1 examined how postgraduate students experience supervisor feedback during dissertation writing. Findings showed that timely, specific, and action-oriented feedback improved students’ confidence and helped them revise their chapters more effectively.
Research Paper Results Section
Students who used the revision checklist made fewer structural errors in their final submissions than students who did not use the checklist. The most noticeable improvements were found in paragraph organization, citation placement, and conclusion clarity.
PowerPoint Findings Summary
Key finding: Students valued feedback most when it was specific, timely, and linked to assessment criteria. This suggests that feedback quality may matter more than feedback quantity.
Common Mistakes When Presenting Research Findings
One common mistake is presenting findings that do not answer the research questions. This weakens the focus of the study.
Another mistake is including too much raw data. Readers need organized findings, not unfiltered transcripts or statistical outputs.
Some students repeat tables word for word. Instead, summarize the key message and allow the table to provide detail.
Unclear visuals also reduce quality. A chart should have readable labels, a clear title, and a direct purpose.
Do not mix findings and discussion too early unless your institution allows an integrated format. If the findings chapter becomes too interpretive, the discussion chapter may become repetitive.
Avoid reporting statistics without explanation. Readers need to know what the result shows.
Do not over-interpret results. A finding can suggest, indicate, or show a relationship, but unsupported claims should be avoided.
Unexpected or negative findings should not be ignored. They may be important to the study.
In qualitative research, avoid using too many quotes. Quotes should support themes, not replace analysis.
Explain participant labels clearly. Readers should understand whether P1, Student 4, or Nurse B refers to an interviewee, focus group participant, or case.
Present findings in a logical order. Random sequencing makes the section hard to follow.
Use consistent decimal places. Inconsistent reporting looks careless.
Do not hide important findings in appendices. Appendices can support the main text, but key findings belong in the findings section.
Avoid unsupported claims. Every finding should be grounded in data.
Checklist for Presenting Research Findings
Use this checklist before submitting your findings chapter, results section, report, or presentation:
| Checklist Item | Completed? |
|---|---|
| Findings answer the research questions or objectives | |
| Findings are organized logically | |
| Irrelevant results have been removed | |
| Tables and figures are clearly titled | |
| Every visual is explained in the text | |
| Quantitative findings include appropriate statistics | |
| Qualitative findings include clear themes and relevant evidence | |
| Participant confidentiality is protected | |
| Findings are not over-discussed | |
| The section has a clear summary | |
| Formatting follows institutional or journal guidelines |
Final Thoughts on How to Present Research Findings
Learning how to present research findings is essential for producing a clear dissertation, thesis, research paper, report, or academic presentation. Strong findings presentation depends on structure, relevance, evidence, and clarity. Your findings should answer the research questions, use tables and figures wisely, present statistics accurately, include qualitative evidence carefully, and prepare the reader for interpretation in the discussion.
The best findings sections do not overwhelm readers with raw data. They guide readers through the evidence and show exactly what the study discovered.
FAQ: How to Present Research Findings
How do you present research findings?
Present research findings by organizing them around your research questions, objectives, hypotheses, or themes. Start with the main finding, support it with evidence, use tables or quotes where helpful, and explain what each result shows.
What is the best way to present findings in a dissertation?
The best way is to structure the findings chapter by research question, objective, hypothesis, or theme. Include a short introduction, participant or sample overview, organized findings, relevant visuals, and a summary before moving to the discussion chapter.
How do you present qualitative research findings?
Present qualitative findings through themes, subthemes, categories, patterns, and selected participant quotes. Introduce each theme, explain what it means, support it with evidence, and protect participant confidentiality.
How do you present quantitative research findings?
Present quantitative findings using clear narrative explanations supported by tables, charts, and statistics. Report descriptive statistics, relationships, group differences, confidence intervals, p-values, and effect sizes where appropriate.
Should findings include interpretation?
Findings should include limited explanation of what the result shows, but deeper interpretation usually belongs in the discussion section. Some qualitative and mixed-methods formats allow integrated findings and discussion.
What is the difference between findings and discussion?
Findings present what the data revealed. Discussion explains what the findings mean in relation to literature, theory, context, limitations, and implications.
How many tables should be included in a findings chapter?
There is no fixed number. Include tables only when they improve clarity. Do not add tables that repeat text or present irrelevant outputs.
How do you present research findings in PowerPoint?
Use simple slides, readable charts, and one key takeaway per slide. Present the most important findings only, explain them verbally, and avoid overcrowding slides with full tables or long paragraphs.
Can research findings include quotes?
Yes. Qualitative findings often include participant quotes. Use short, relevant quotes that support themes and protect participant identity.
How do you present unexpected findings?
Present unexpected findings honestly and clearly. Explain what the data showed without forcing the result to match your assumptions. Discuss possible explanations later in the discussion section.
References
APA Style Journal Article Reporting Standards (APA Style JARS. (2020). APA Style Journal Article Reporting Standards (APA Style JARS). https://apastyle.apa.org/jars
American Psychological Association. (n.d.). Mixed methods research design (JARS–Mixed). APA Style. https://apastyle.apa.org/jars/mixed-methods
American Psychological Association. (n.d.). Tables and figures. APA Style. https://apastyle.apa.org/style-grammar-guidelines/tables-figures
Creswell, J. W., & Creswell, J. D. (2023). Research design: Qualitative, quantitative, and mixed methods approaches (6th ed.). SAGE Publications. https://journals.sagepub.com/doi/abs/10.1177/15586898221086346
Davis, J. (n.d.). Syllabus TMGT 335 -Managing Sustainability Spring 2025 TMGT 335 -Managing Sustainability PRELIMINARY COURSE SYLLABUS: Spring 2025 (252). http://faculty.tamuc.edu/jdavis/tmgt/335/252/TMGT335-252-Syllabus.pdf
Levitt, H. M., Bamberg, M., Creswell, J. W., Frost, D. M., Josselson, R., & Suárez-Orozco, C. (2018). Journal article reporting standards for qualitative primary, qualitative meta-analytic, and mixed methods research in psychology: The APA Publications and Communications Board task force report. American Psychologist, 73(1), 26–46. https://doi.org/10.1037/amp0000151
Lincoln, Y. S., & Guba, E. G. (1985). Naturalistic inquiry. International Journal of Intercultural Relations, 9(4), 289–331. http://dx.doi.org/10.1016/0147-1767(85)90062-8
Purdue Online Writing Lab. (2022.). APA tables and figures. Purdue University. https://owl.purdue.edu/owl/research_and_citation/apa_style/apa_formatting_and_style_guide/apa_tables_and_figures.html
Schulz, K. F., Altman, D. G., Moher, D., & CONSORT Group. (2010). CONSORT 2010 statement: Updated guidelines for reporting parallel group randomised trials. BMC Medicine, 8, Article 18. https://doi.org/10.1186/1741-7015-8-18
Tong, A., Sainsbury, P., & Craig, J. (2007). Consolidated criteria for reporting qualitative research: A 32-item checklist for interviews and focus groups. International Journal for Quality in Health Care, 19(6), 349–357. https://doi.org/10.1093/intqhc/mzm042
