

Suppose a nurse researcher wants to know whether a structured, nurse-led education program improves medication adherence compared with usual care. After the study, the education group scores a few points higher on average. Is that gap evidence of a real difference, or could it easily appear by sampling variation alone? Null hypothesis testing is the standard way to answer that question: you assume there is no difference, then check how surprising your data would be if that assumption were true.
Nursing researchers rarely study every patient in a population. They study a sample and want to say something about the wider group. Null hypothesis testing gives them a structured, prespecified rule for weighing sample evidence about differences, associations, or effects in that population.
What Is Null Hypothesis Testing?
Null hypothesis testing is a statistical procedure for evaluating how compatible the observed data are with a specified null hypothesis, given a statistical model and its assumptions. The American Statistical Association describes p-values, the main output of this procedure, as a measure of how incompatible data are with a specified statistical model (Wasserstein & Lazar, 2016).
The procedure does not prove any hypothesis true or false with certainty. It tells you whether your data would be unusual under the null hypothesis. If they would be, you have evidence against the null. If they would not, you lack sufficient evidence against it, which is a different thing from showing that it is correct.
A simple nursing example. A ward tests whether nurses’ hand-hygiene audit scores differ between day and night shifts. The null hypothesis says the average scores are the same in the population of shifts. The test asks: if day and night shifts truly scored the same on average, how likely is a sample gap at least as large as the one we observed?
What Are the Null and Alternative Hypotheses?
Every null hypothesis test sets two competing statements against each other before any data are analyzed.
- Null hypothesis (H0): usually states no difference, no association, or no effect under the model being tested. It is the statement the test evaluates.
- Alternative hypothesis (H1 or Ha): states a competing claim, such as a difference, association, or effect. It is what the researcher considers if the data are hard to reconcile with H0.
The null hypothesis is the formal basis for testing statistical significance, and both hypotheses should be stated in advance rather than after seeing the data (Banerjee et al., 2009).
| Feature | Null hypothesis (H0) | Alternative hypothesis (H1) |
| What it states | No difference, association, or effect | A difference, association, or effect exists |
| Role in the test | Assumed true while the p-value is calculated | Considered when the data are hard to reconcile with H0 |
| Adherence example | Population mean adherence scores are equal in both groups | Population mean adherence scores differ between groups |
| Notation (two-sided) | μ₁ = μ₂ | μ₁ ≠ μ₂ |
In the notation, μ (mu) stands for a population mean: μ₁ for patients receiving structured education and μ₂ for patients receiving usual care. This point matters. H0 does not claim that the two sample means will be identical. Sample means almost always differ a little. H0 claims that the population means are equal, so any sample difference reflects sampling variation.
In plain English, for the adherence study:
- H0: On average, patients who receive the structured nurse-led education program have the same adherence scores as patients who receive usual care.
- H1: On average, the two groups’ adherence scores differ.
This H1 is two-sided: it allows a difference in either direction. A one-sided alternative (education scores are higher) needs a strong prior justification and must be chosen before analysis, not switched to afterwards to reach significance (Banerjee et al., 2009).
How Does Null Hypothesis Testing Work?
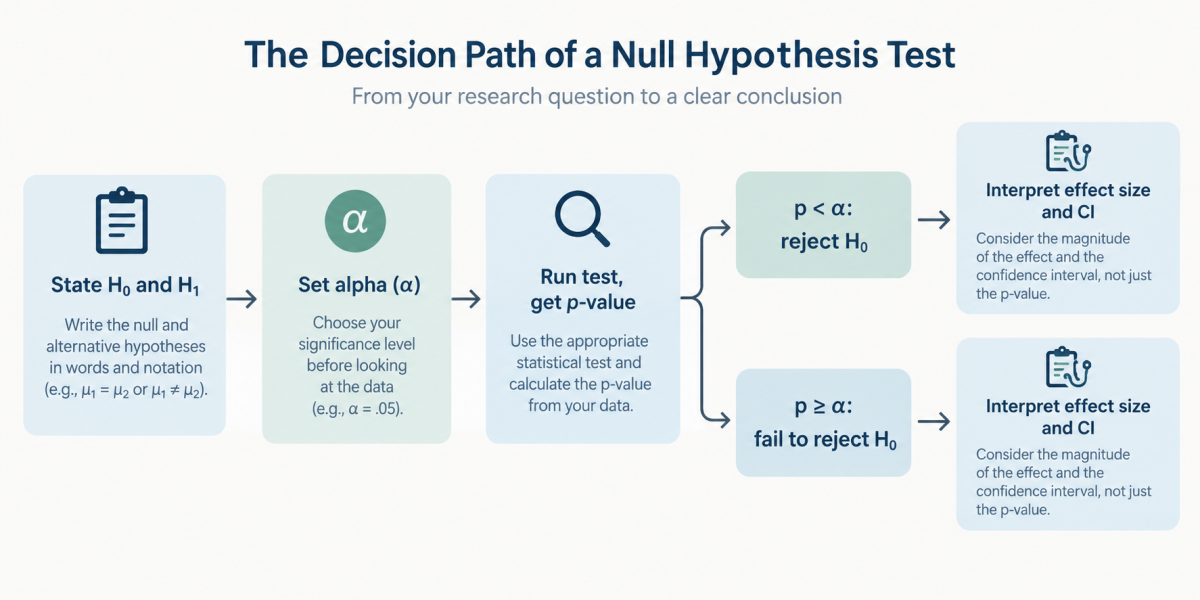
The procedure follows nine steps. The order matters, because several decisions must be fixed before the results are seen.
- Formulate a research question. Example: Does structured nurse-led education change medication adherence scores compared with usual care?
- State H0 and H1. Write both in words and notation, as above.
- Choose a suitable statistical test. The test depends on the design, the type of outcome variable, whether groups are independent or paired, and the test’s assumptions. Two independent groups with a continuous outcome often point to an independent-samples t-test. Our guide to choosing the right statistical test in nursing research covers this decision in detail.
- Specify the significance level (alpha, α) before examining results. Alpha is the threshold for rejecting H0. It is commonly set at .05, but it is a convention, not a law.
- Collect and prepare the data. Clean, code, and check the data before testing.
- Calculate the test statistic and p-value. The test statistic (such as t) summarizes how far the data depart from H0. The p-value converts that into a probability under H0.
- Evaluate the evidence. Look at the effect estimate (for example, the mean difference) and its confidence interval, not just the p-value.
- Make a decision about H0. Compare the p-value with the prespecified alpha: reject H0 or fail to reject it.
- Interpret the finding in context. Translate the decision back into the nursing research question, with attention to design, magnitude, and clinical relevance.
A significance threshold cannot rescue a weak study. If the design is biased, the measure is unreliable, or the sample is too small, the p-value inherits those problems. Statistical tests should never be the sole input to conclusions about an effect (Greenland et al., 2016).
What Does the P-Value Mean in Null Hypothesis Testing?
Definition. The p-value is the probability, assuming the null hypothesis and the statistical model’s assumptions hold, of obtaining a test statistic at least as extreme as the one actually observed, under the chosen test (Greenland et al., 2016).
In plain English: pretend H0 is true and every assumption of the test is met. Now imagine repeating the study many times. The p-value is the proportion of those imaginary studies that would produce a result at least as far from “no difference” as yours. A small p-value means your result would be uncommon in a world where H0 is true.
Illustration. With alpha set at .05 in advance, a test returns p = .02. If H0 and the assumptions were true, a result at least this extreme would occur in about 2% of repeated studies. Because .02 is below .05, the result meets the prespecified threshold and H0 is rejected.
The p-value is among the most misread numbers in research. Four corrections matter most (Wasserstein & Lazar, 2016; Yaddanapudi, 2016):
- It is not the probability that H0 is true. The p-value is calculated assuming H0 is true, so it cannot also measure the chance that H0 is true. A p of .02 does not mean a 2% chance of no effect.
- It is not the probability that the findings occurred purely by chance. It describes how the data compare with a specific model, not the probability that chance alone produced them.
- A small p-value does not measure the size or clinical importance of an effect. A tiny difference can produce a very small p-value in a large sample.
- A p-value above .05 does not prove that no effect exists. It means the data were not unusual enough under H0 to reject it at that threshold.
For reporting p-values in APA style, reading SPSS “Sig.” columns, and a fuller list of misinterpretations, see our guide to interpreting and reporting p-values in nursing research.
When Do You Reject or Fail to Reject the Null Hypothesis?
The decision rule is set before the analysis. With alpha = .05:
- If p < .05: the result is statistically significant under the specified testing framework. Reject H0.
- If p > .05: the result is not statistically significant at that threshold. Fail to reject H0.
- If p = .05 exactly: the decision follows whatever rule was prespecified. Many textbooks and software conventions reject when p ≤ α. Whichever convention you use, state it in your analysis plan, and recognize that p = .049 and p = .051 represent almost identical evidence.
Why “fail to reject” and not “accept”? A test can only show that data are, or are not, hard to reconcile with H0. Not finding enough evidence against H0 is not the same as finding evidence for it. A small or noisy study can easily miss a real effect. As Altman and Bland put it in their classic note, absence of evidence is not evidence of absence (Altman & Bland, 1995). “Accept the null hypothesis” implies a certainty the test cannot provide.
Statistical significance is not clinical significance. Rejecting H0 tells you the data are unusual under “no difference.” It does not tell you whether the difference is large enough to matter to patients, whether it was caused by the intervention, or whether it applies to other settings. Those judgements depend on the effect size, confidence interval, study design, and clinical context.
What Are Type I and Type II Errors?
Because decisions rest on sample data, two kinds of error are possible (Banerjee et al., 2009).
| Term | Definition | Nursing illustration |
| Type I error (false positive) | Rejecting a true H0. Its probability, when H0 is true, is alpha (α). | Concluding that the education program changes adherence when, in the population, it does not |
| Type II error (false negative) | Failing to reject a false H0. Its probability is beta (β). | Concluding there is insufficient evidence of a difference when the program genuinely changes adherence |
| Statistical power (1 − β) | The probability of rejecting H0 under a specified alternative effect, when the analysis assumptions hold | The chance a study with 60 patients per group detects a specified true difference in adherence |
Lowering alpha reduces Type I errors but, for a fixed sample size, raises the risk of Type II errors. The usual way to keep both low is adequate sample size, planned before data collection. Our guide to statistical power and sample size planning explains how to do this.
Example of Null Hypothesis Testing in Nursing Research
The following example is entirely hypothetical. The numbers were constructed to illustrate the reasoning and do not come from any real study.
- Research question. Among adults with hypertension, does a structured nurse-led education program change medication adherence scores compared with usual care?
- H0: μ₁ = μ₂ (equal population mean adherence scores). H1: μ₁ ≠ μ₂ (the population means differ). Two-sided, stated before data collection.
- Outcome and groups. Outcome: a continuous medication adherence score (0 to 100). Groups: 60 patients randomly allocated to structured education and 60 to usual care.
- An independent-samples t-test, provided observations are independent and score distributions are reasonably symmetric. If assumptions were clearly violated, an alternative such as the Mann-Whitney U test or Welch’s t-test would be considered. Alpha is set at .05.
- Hypothetical result. Education group mean = 78.6; usual care mean = 73.8; pooled SD = 11.9. Mean difference = 4.8 points, t(118) = 2.21, p = .03, 95% CI [0.5, 9.1], Cohen’s d = 0.40.
- Interpreting the p-value. If H0 were true and the assumptions held, a difference at least this large would occur in about 3% of repeated studies of this size. That is below the prespecified alpha of .05.
- Reject H0.
- “Patients in the structured education group had higher mean adherence scores than those in usual care (mean difference 4.8 points, 95% CI 0.5 to 9.1, p = .03).”
Notice what this conclusion does not say. It does not say the program “works” or “proves” anything. Random allocation strengthens a causal interpretation, but adherence was still measured in one hypothetical setting. The confidence interval runs from 0.5 to 9.1 points. A half-point gain would be clinically trivial, while a nine-point gain might matter. Whether this result justifies changing practice depends on the minimal clinically important difference for this adherence scale, study quality, and replication.
Contrast: p = .12. Suppose instead the mean difference had been 3.0 points, giving t(118) = 1.57, p = .12, 95% CI [−0.8, 6.8]. Now p exceeds .05, so we fail to reject H0. The correct conclusion is that the study did not provide sufficient evidence of a difference at the .05 level. It would be wrong to conclude that the program has no effect: the interval still includes differences of up to 6.8 points in favor of education.
Common Mistakes in Null Hypothesis Testing
- Misreading the p-value. Mistake: “p = .03 means a 3% chance the result is due to chance.” Correction: the p-value is computed assuming H0 and the model are true. It is not the probability of either hypothesis or of chance alone.
- Treating non-significance as proof of no effect. Mistake: “p = .12, so the intervention does not work.” Correction: say the study did not find sufficient evidence of a difference, and report the confidence interval and the study’s power (Altman & Bland, 1995).
- Treating significance as proof of clinical importance. Mistake: reporting p < .001 as if it shows a large or meaningful effect. Correction: report and interpret the effect size and its confidence interval against a clinically meaningful difference.
- Choosing an inappropriate test. Mistake: using an independent-samples t-test on pre- and post-test scores from the same patients. Correction: match the test to the design, variable type, and assumptions before analysis.
- Ignoring assumptions and analysis plans. Mistake: running many tests, then reporting those that reached significance, or switching to a one-sided test after seeing the data. Correction: prespecify hypotheses, tests, and alpha. Selecting analyses by their p-values can produce small p-values even when H0 is true (Greenland et al., 2016).
- Reporting only the decision. Mistake: “H0 was rejected (p < .05).” Correction: report the effect estimate, its uncertainty, the exact p-value, and what the result means for the research question (Wasserstein & Lazar, 2016).
Frequently Asked Questions
What is null hypothesis testing in simple terms? It is a way of checking whether your data are surprising under the assumption that there is no difference, association, or effect. If the data would be unusual under that assumption, you reject the null hypothesis. If not, you fail to reject it.
What is an example of a null hypothesis in nursing research? “There is no difference in mean postoperative pain scores between patients who receive preoperative education and patients who receive standard care.” It refers to the population, and it is stated before the data are analyzed.
Can a null hypothesis be proven true? No. A test can only show that the data are, or are not, hard to reconcile with H0. Failing to reject H0 may reflect a small or imprecise study rather than a true absence of effect. Equivalence or non-inferiority designs are needed to show that an effect is negligibly small.
Is null hypothesis testing the same as interpreting a p-value? No. The p-value is one output of the procedure. Null hypothesis testing also includes stating hypotheses in advance, choosing a test and alpha, making a decision, and interpreting the result alongside effect sizes, confidence intervals, and study design.
Conclusion
Null hypothesis testing asks one disciplined question: if there were truly no difference, association, or effect in the population, how surprising would these data be? Researchers state H0 and H1 in advance, choose a suitable test and alpha, then reject or fail to reject H0 based on the p-value. A p-value describes the data’s compatibility with H0. It is not the probability that H0 is true, and it does not measure effect size or clinical importance. Sound conclusions combine the decision with the effect estimate, its confidence interval, the study design, and clinical judgement.
Once the logic is clear, the next step is matching it to your own study design and outcome variables. Our guide to choosing statistical tests is a good place to continue. If you are applying hypothesis testing to a dissertation, DNP project, or capstone and need structured guidance, our inferential statistics help for nursing research can support you with test selection, interpretation, and reporting.
References
Altman, D. G., & Bland, J. M. (1995). Absence of evidence is not evidence of absence. BMJ, 311(7003), 485. https://doi.org/10.1136/bmj.311.7003.485
Banerjee, A., Chitnis, U. B., Jadhav, S. L., Bhawalkar, J. S., & Chaudhury, S. (2009). Hypothesis testing, type I and type II errors. Industrial Psychiatry Journal, 18(2), 127–131. https://doi.org/10.4103/0972-6748.62274
Greenland, S., Senn, S. J., Rothman, K. J., Carlin, J. B., Poole, C., Goodman, S. N., & Altman, D. G. (2016). Statistical tests, P values, confidence intervals, and power: A guide to misinterpretations. European Journal of Epidemiology, 31(4), 337–350. https://doi.org/10.1007/s10654-016-0149-3
Wasserstein, R. L., & Lazar, N. A. (2016). The ASA’s statement on p-values: Context, process, and purpose. The American Statistician, 70(2), 129–133. https://doi.org/10.1080/00031305.2016.1154108
Yaddanapudi, L. N. (2016). The American Statistical Association statement on P-values explained. Journal of Anaesthesiology Clinical Pharmacology, 32(4), 421–423. https://doi.org/10.4103/0970-9185.194772
