

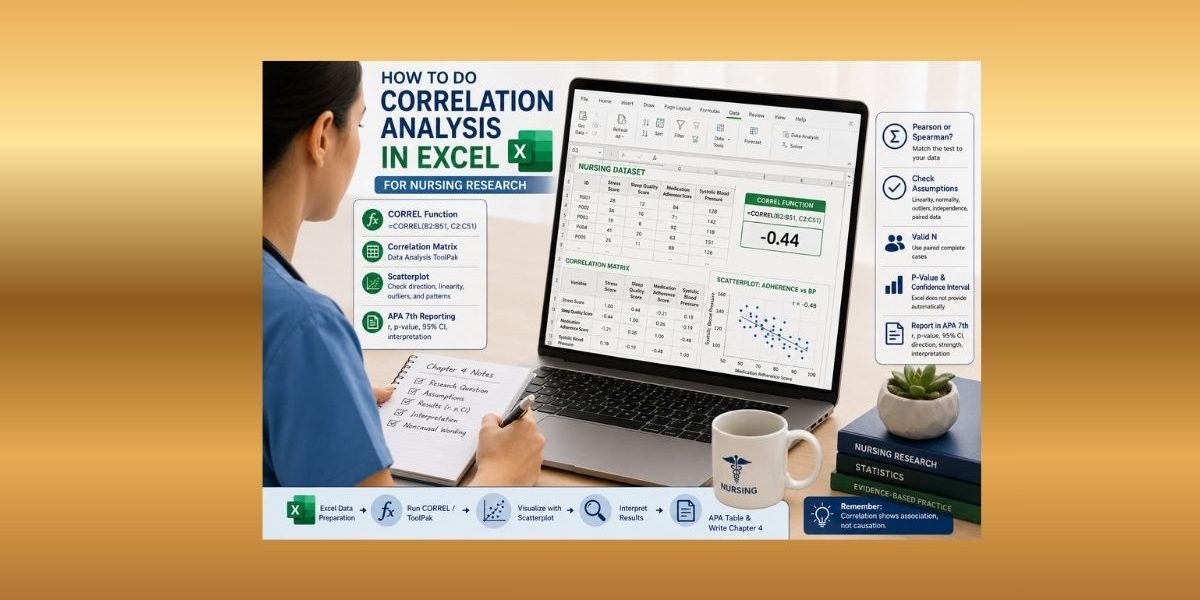
Introduction
Many nursing students have their data in Excel and want to know whether two variables are related. You may have stress score and sleep quality score, medication adherence score and systolic blood pressure, pain score and quality-of-life score, patient satisfaction score and nurse communication score, or burnout score and job satisfaction score. The problem is that Excel can calculate a correlation coefficient quickly, but students are often unsure whether that coefficient is enough for a dissertation, thesis, capstone project, DNP project, or Chapter 4 results section.
Knowing how to do correlation analysis in Excel for nursing research is useful because Excel is familiar, accessible, and practical for basic analysis. Excel can calculate Pearson correlation coefficients, create a basic correlation matrix, and produce scatterplots. Microsoft’s CORREL function returns the correlation coefficient for two cell ranges, while the PEARSON function returns Pearson’s product-moment correlation coefficient, r (Microsoft, n.d.-a; Microsoft, n.d.-b).
However, dissertation-level reporting usually requires more than a coefficient. Students may need a p-value, confidence interval, valid sample size, assumption checks, missing-data explanation, scatterplot review, APA 7th table, and clear Chapter 4 interpretation. Excel is strongest when the student needs a simple Pearson correlation or an early look at whether two variables appear related. It becomes less sufficient when the dataset has missing data, ordinal or Likert-scale variables, non-normal distributions, many variables, unclear assumptions, or committee requirements for full statistical reporting.
This guide explains how to run correlation analysis in Excel, how to use the CORREL function, how to use the Excel Data Analysis ToolPak for a correlation matrix, how to create and interpret scatterplots, how to avoid common Excel mistakes, and how to report Excel correlation results in APA 7th edition. It also explains when Excel is enough and when SPSS, Jamovi, JASP, R, or expert statistical support may be safer.
For the broader statistical context, use the main guide on correlation analysis in nursing research. For deeper test-specific guidance, review Pearson correlation analysis in nursing research. You may also need inferential data analysis in nursing research if your Chapter 4 requires statistical significance testing.
Can You Do Correlation Analysis in Excel?
Yes. Excel can be used for basic correlation analysis. It can calculate a Pearson correlation coefficient using the CORREL function or the PEARSON function. Excel can also create a basic correlation matrix through the Data Analysis ToolPak and produce scatterplots for visual inspection. Microsoft describes the Analysis ToolPak as an Excel add-in that provides statistical and engineering analysis tools and produces output tables for selected analyses (Microsoft, n.d.-d).
Excel can help nursing students with basic Pearson correlation, correlation matrices, scatterplots, visual inspection of relationships, early data exploration, and simple checks before using SPSS or another statistical tool.
However, Excel does not automatically provide everything a dissertation student needs. The basic CORREL function gives the coefficient only. The basic ToolPak correlation output gives a matrix of coefficients, but it does not automatically give full APA-ready results with p-values, confidence intervals, assumption checks, missing-data explanations, or Chapter 4 interpretation.
Excel can help you calculate a number. It does not automatically tell you whether the test is correct, whether assumptions are acceptable, whether the coefficient is statistically significant, or how to explain the result in nursing terms.
When Excel Is Suitable for Correlation Analysis
Excel may be suitable when the analysis is simple, the dataset is clean, and the student is doing an early or basic relationship check.
Excel is most useful for small to moderate datasets, simple two-variable Pearson correlation, early exploration of relationships, Pearson correlation between continuous variables, basic scatterplots, preliminary dissertation analysis, and checking whether two variables appear related before using SPSS or another tool.
For example, Excel may be useful if a nursing student wants to examine whether medication adherence score is negatively related to systolic blood pressure in a clean dataset where both variables are continuous and measured on the same participants.
Excel may also be useful when a student wants to create a quick scatterplot of burnout score and job satisfaction score before deciding whether the relationship is linear enough for Pearson correlation.
Excel is less ideal when the student needs full inferential reporting. Nursing dissertations often require more than a coefficient. If your committee expects p-values, confidence intervals, APA tables, and formal interpretation, Excel alone may not be enough.
When Excel May Not Be Enough for a Nursing Dissertation
Excel may not be enough when the analysis requires full dissertation-level statistical reporting.
Students should consider SPSS, Jamovi, JASP, R, or professional statistical help when the committee requires p-values, confidence intervals, APA-ready tables, Spearman correlation, formal assumption checks, exact statistical reporting, or Chapter 4 interpretation. Excel may also be insufficient when there are many variables, missing data, ordinal data, skewed variables, non-normal distributions, or uncertainty about whether correlation is the correct test.
This matters because correlation is commonly misused in medical research. Mukaka (2012) explains that correlation is simple to calculate but often misused when researchers ignore measurement type, assumptions, interpretation limits, and the difference between association and causation (Mukaka, 2012).
If your research question, variable type, assumption checks, or committee expectations are unclear, Excel should be treated as a starting point rather than the final statistical solution.
Prepare Your Nursing Dataset Before Running Correlation in Excel
The quality of the correlation result depends on the quality of the dataset. A wrong range, blank cell, text entry, missing score, sorting error, or incorrect questionnaire total can produce a misleading result.
In Excel, each row should represent one participant or case. Each column should represent one variable. The dataset should have clear variable names, no blank rows inside the data range, and numeric values where numeric values are expected.
Before running correlation analysis, check for missing values, impossible values, coding errors, and questionnaire scoring problems. If a stress questionnaire has reverse-coded items, those items must be corrected before calculating the total score. If a satisfaction scale requires an average score, do not correlate individual items unless your research question specifically uses item-level responses.
For broader preparation guidance, review descriptive data analysis in nursing research.
Excel Correlation Data Preparation Checklist
| Check | What to do | Why it matters |
|---|---|---|
| One row per participant | Keep each participant on one row | Prevents duplicated or mismatched cases |
| One variable per column | Put stress score, sleep score, adherence score, and blood pressure in separate columns | Allows Excel to select correct ranges |
| Clear variable names | Use labels such as Stress Score and Sleep Quality Score | Reduces range-selection mistakes |
| No blank rows inside the dataset | Remove blank lines between participants | Prevents incomplete range selection |
| Missing values identified | Mark or review missing scores | Missing values reduce valid cases |
| Impossible values checked | Look for values outside the valid range | Prevents data-entry errors from distorting results |
| Questionnaire scoring verified | Compute total or average scores correctly | Correlation is only valid if scores are correct |
| Reverse-coded items corrected | Reverse-code before total scores are calculated | Prevents wrong direction of results |
| Text removed from numeric columns | Avoid entries such as “missing,” “N/A,” or “none” in numeric ranges | Text values can cause errors or incorrect selection |
| Same participants measured on both variables | Confirm both variables are available for the same cases | Correlation requires paired observations |
| Full dataset sorted together | Sort entire rows, not one variable column alone | Protects participant matching |
A student who is unsure about cleaning, scoring, or structuring the dataset should fix those issues before running any correlation analysis. Nursing Dissertation Help can support students with Excel dataset cleaning, questionnaire scoring, and Chapter 4-ready variable preparation.
Example Nursing Dataset for Excel Correlation Analysis
A simple Excel dataset for correlation analysis may look like this:
| Participant ID | Stress Score | Sleep Quality Score | Medication Adherence Score | Systolic Blood Pressure | Patient Satisfaction Score |
|---|---|---|---|---|---|
| P001 | 28 | 12 | 84 | 128 | 4.6 |
| P002 | 34 | 16 | 71 | 142 | 3.8 |
| P003 | 19 | 8 | 92 | 118 | 4.9 |
| P004 | 41 | 20 | 63 | 151 | 3.4 |
| P005 | 25 | 11 | 88 | 126 | 4.5 |
| P006 | 37 | 18 | 69 | 146 | 3.7 |
In this structure, each row is one participant. Each column is one variable. A student could correlate Stress Score with Sleep Quality Score, Medication Adherence Score with Systolic Blood Pressure, or Patient Satisfaction Score with another numeric rating.
This arrangement matters because Excel uses ranges. If the ranges do not contain the same participants in the same order, the correlation result can be wrong.
Method 1: Using the CORREL Function in Excel
The CORREL function is the simplest way to calculate a Pearson correlation coefficient in Excel. Microsoft defines the syntax as CORREL(array1, array2), where array1 and array2 are the two ranges of cell values being correlated (Microsoft, n.d.-a).
Step-by-Step: Pearson Correlation Using CORREL
Open your Excel dataset. Confirm that each row represents one participant and each variable is in its own column. Click an empty cell where you want the result to appear. Type the formula using the two variable ranges, then press Enter.
For example, if Stress Score is in cells B2:B51 and Sleep Quality Score is in cells C2:C51, use:
=CORREL(B2:B51, C2:C51)
Excel will return one number, such as −.42, .18, or .67. That number is the correlation coefficient.
Important Checks Before Pressing Enter
Both ranges should have the same number of cases. The ranges should refer to the same participants. The formula should not include the header row. The variable columns should contain numeric values. Blank cells should be reviewed before analysis. Text values should not be mixed with numeric data.
The CORREL function gives the coefficient only. It does not automatically give the p-value, confidence interval, APA interpretation, assumption check, or Chapter 4 write-up.
How to Interpret the CORREL Result
The CORREL result ranges from −1 to +1.
A positive value means that as one variable increases, the other tends to increase. A negative value means that as one variable increases, the other tends to decrease. A value close to zero means there is little or no linear relationship. A value closer to −1 or +1 means a stronger relationship.
The sign shows direction, not importance. A correlation of −.60 is stronger than a correlation of .25 because .60 is farther from zero. The negative sign only means the relationship moves in the opposite direction.
Schober et al. (2018) explain that correlation coefficients should be interpreted based on direction, strength, data pattern, and context, not simply whether the value appears large or small (Schober et al., 2018).
Table 1. General Guide for Interpreting Excel Correlation Coefficients
| Correlation coefficient | General strength | Direction | Nursing interpretation caution |
|---|---|---|---|
| 0 to ±.09 | Very weak or negligible | Positive or negative | May have little practical meaning |
| ±.10 to ±.29 | Weak | Positive or negative | Can be statistically significant in large samples but still weak |
| ±.30 to ±.49 | Moderate | Positive or negative | May be meaningful depending on the nursing context |
| ±.50 to ±.69 | Strong | Positive or negative | Check for outliers or overlapping constructs |
| ±.70 to ±1.00 | Very strong | Positive or negative | May suggest very similar variables or scoring overlap |
These thresholds are general guides, not absolute rules. In nursing research, a weak relationship may still matter if the outcome involves patient safety, readmission, medication adherence, symptom control, or treatment follow-up.
Method 2: Using Excel Data Analysis ToolPak for a Correlation Matrix
The Excel Data Analysis ToolPak is useful when a student wants to calculate correlations among several variables at once. Microsoft explains that the ToolPak can perform complex statistical analysis and display results in output tables (Microsoft, n.d.-d).
How to Enable the Data Analysis ToolPak
If the Data Analysis button is not visible, click File, click Options, click Add-ins, select Excel Add-ins beside Manage, click Go, check Analysis ToolPak, and click OK. Then go to the Data tab and look for Data Analysis.
How to Run the Correlation Tool
Click the Data tab, click Data Analysis, choose Correlation, and click OK. Select the Input Range. Choose Grouped By Columns if your variables are in columns. Check Labels in First Row if your selected range includes variable names. Choose Output Range or New Worksheet Ply. Click OK.
Excel will produce a correlation matrix.
Important ToolPak Limitation
The ToolPak correlation output is a basic correlation matrix for numeric measurement variables. In practice, students usually use it as a Pearson-style correlation matrix. It is not a direct Spearman correlation workflow. If you need Spearman correlation, Excel requires ranking the variables first or using another statistical tool.
This method is useful when the student wants correlations among stress score, sleep quality score, medication adherence score, systolic blood pressure, and patient satisfaction score. It is less useful if the student needs p-values, confidence intervals, Spearman output, formal assumption checks, or a complete APA-ready table.
How to Read a Correlation Matrix in Excel
A correlation matrix shows the correlations among several variables. The same variables appear in rows and columns.
The diagonal values are always 1.00 because each variable is perfectly correlated with itself. The off-diagonal values show the correlation between two different variables.
Sample Excel Correlation Matrix
| Variable | Stress Score | Sleep Quality Score | Medication Adherence Score | Systolic Blood Pressure |
|---|---|---|---|---|
| Stress Score | 1.00 | −.44 | −.21 | .18 |
| Sleep Quality Score | −.44 | 1.00 | .26 | −.19 |
| Medication Adherence Score | −.21 | .26 | 1.00 | −.48 |
| Systolic Blood Pressure | .18 | −.19 | −.48 | 1.00 |
In this example, Stress Score and Sleep Quality Score have a negative correlation of −.44. If higher sleep quality scores mean better sleep, this suggests that higher stress is associated with lower sleep quality. Medication Adherence Score and Systolic Blood Pressure have a negative correlation of −.48, suggesting that higher adherence is associated with lower systolic blood pressure.
A correlation matrix does not automatically prove statistical significance. The basic Excel matrix does not automatically provide p-values. Students should avoid writing “significant” unless they have calculated or obtained the correct significance test.
Method 3: Creating a Scatterplot for Correlation in Excel
A scatterplot is essential because a correlation coefficient alone can hide non-linear patterns, outliers, clusters, and unusual data problems. Microsoft’s Excel scatter chart guidance explains that users can select data, go to the Insert tab, and choose a Scatter chart to display paired values (Microsoft, n.d.-e).
How to Create a Scatterplot in Excel
Select the two variables you want to plot. Click Insert. Choose Scatter or X Y Scatter. Select the basic scatterplot option. Add a clear chart title. Label the x-axis and y-axis. Add a trendline if useful. Display R-squared only if you know how to interpret it.
For example, a student may put Medication Adherence Score on the x-axis and Systolic Blood Pressure on the y-axis. If the dots slope downward, higher adherence may be associated with lower blood pressure.
Use R-Squared Carefully
Excel may allow students to display R-squared on a trendline. R-squared is not the same as the correlation coefficient. In simple linear regression with one predictor, R-squared is related to the squared correlation, but students should not copy R-squared and report it as Pearson’s r.
A common mistake is writing that the correlation is .36 when Excel displayed R² = .36. If R² = .36 in a simple linear relationship, the absolute correlation is about .60, not .36. Students should use CORREL, PEARSON, or the correlation matrix for the correlation coefficient.
How to Interpret a Scatterplot in Excel
A scatterplot helps students decide whether the correlation result makes sense.
An upward pattern suggests a positive relationship. For example, higher nurse communication scores may be associated with higher patient satisfaction scores.
A downward pattern suggests a negative relationship. For example, higher medication adherence scores may be associated with lower systolic blood pressure.
A random cloud suggests a weak or no relationship. A curved pattern may mean Pearson correlation is not ideal because Pearson correlation measures linear association. Extreme points may affect the correlation coefficient. Clusters may suggest subgroups, such as different clinical units, age groups, or patient categories.
Visual inspection should support statistical interpretation. A coefficient without a scatterplot can be misleading. If one or two outliers drive the result, the correlation may not represent the overall sample.
Can Excel Do Pearson Correlation?
Yes. Excel can calculate Pearson correlation using the CORREL function, the PEARSON function, and the Data Analysis ToolPak. Microsoft states that the PEARSON function returns Pearson’s product-moment correlation coefficient, r, a value from −1.0 to 1.0 that reflects the extent of a linear relationship between two datasets (Microsoft, n.d.-b).
Pearson correlation is suitable when both variables are continuous or approximately continuous, the relationship is linear, observations are paired, observations are independent, there are no serious outliers, and the variables are appropriate for Pearson correlation.
For example, Pearson correlation may be suitable for medication adherence score and systolic blood pressure if both are numeric, measured on the same participants, and the scatterplot shows a roughly linear relationship.
For a deeper explanation of when Pearson correlation is appropriate, use Pearson correlation analysis in nursing research.
Can Excel Do Spearman Correlation?
Excel does not provide Spearman correlation as directly as SPSS. Students can perform a Spearman-style analysis manually by ranking both variables first and then correlating the ranks. Microsoft’s RANK.EQ function returns the rank of a number within a list of numbers, and tied values receive the top rank of the tied set (Microsoft, n.d.-c).
The basic idea is to rank variable 1, rank variable 2, and then run correlation on the two rank columns.
This method is more manual and easier to do incorrectly. It can become especially difficult when there are many ties, missing values, reverse-coded items, or multiple variables.
Spearman correlation may be useful for ordinal, ranked, skewed, non-normal, or Likert-type data. However, for dissertation-level reporting, Spearman correlation is often better handled in SPSS, Jamovi, JASP, R, or with expert support.
Pearson vs Spearman in Excel
Excel handles Pearson correlation more easily than Spearman correlation. Pearson can be calculated directly using CORREL, PEARSON, or the ToolPak correlation tool. Spearman usually requires ranking the variables first.
Table 2. Pearson vs Spearman Correlation in Excel
| Feature | Pearson in Excel | Spearman in Excel | Nursing student caution |
|---|---|---|---|
| Best for | Continuous variables with linear relationships | Ordinal, ranked, skewed, or non-normal variables | Match the test to the variable type |
| Excel method | CORREL, PEARSON, or ToolPak |
Rank variables first, then correlate ranks | More manual and easier to make mistakes |
| Output | Correlation coefficient | Correlation of ranked variables | Still needs correct interpretation |
| Scatterplot use | Check linearity | Check monotonic pattern | Visual inspection matters |
| p-values | Not automatic in basic CORREL |
Not automatic in manual ranking method | Use another tool or additional formulas |
| Confidence intervals | Not automatic in basic tools | Not automatic in basic tools | May need SPSS, R, Jamovi, JASP, or expert help |
| Nursing example | Adherence score and systolic blood pressure | Pain rating and satisfaction rating | Use Pearson only when assumptions fit |
Excel is convenient for Pearson correlation, but it is not always the safest tool for Spearman correlation in a dissertation.
Does Excel Give P-Values for Correlation?
This is one of the most important limitations. The CORREL function gives the correlation coefficient only. It does not give the p-value. The basic Data Analysis ToolPak correlation output gives a correlation matrix, but it does not automatically provide a full APA-style result with p-values in the same way SPSS or other statistical packages do.
Many dissertation Chapter 4 sections require statistical significance testing. If your research question asks whether the relationship is statistically significant, reporting only the coefficient is incomplete.
What Is Missing When Excel Gives Only r?
When Excel gives only the correlation coefficient, the student still needs the valid sample size, degrees of freedom, test statistic, p-value, confidence interval if required, the correct correlation method, and an interpretation that connects the result to the nursing research question.
For Pearson correlation, the significance test commonly uses the correlation coefficient and sample size. The test statistic is often calculated as:
t = r√[(n − 2) / (1 − r²)]
with df = n − 2.
A student does not need to show this formula in Chapter 4 unless required, but the formula explains why Excel’s coefficient alone is incomplete. A correlation of .40 means something different when n = 18 than when n = 180.
Why Sample Size Changes Significance Even When r Is the Same
Assume Excel gives the same Pearson correlation coefficient in two studies:
Study A: r = .40, n = 20
Study B: r = .40, n = 120
The coefficient is the same in both studies, but Study B has much more statistical power because it has a larger sample. Study A may fail to reach statistical significance, while Study B may be statistically significant. This is why reporting only r is not enough for many dissertations. The valid n, p-value, and confidence interval help the reader understand whether the result is precise, statistically supported, and meaningful.
The American Statistical Association warns that p-values do not measure effect size, importance, or causation, so students should interpret them together with coefficient size, sample size, confidence intervals, and context (Wasserstein & Lazar, 2016).
A dissertation student should not write, “The Excel correlation was significant,” unless the correct p-value was actually calculated or obtained from appropriate statistical software.
Does Excel Give Confidence Intervals for Correlation?
Basic Excel correlation tools do not automatically provide confidence intervals for correlation coefficients. Confidence intervals help show uncertainty around the estimated relationship.
For example, a correlation of −.42 may look moderate, but the confidence interval may show that the population relationship could be weak, moderate, or strong. A narrow confidence interval suggests more precision. A wide interval suggests more uncertainty.
Why Confidence Intervals Matter
Two studies can have the same correlation coefficient but different certainty.
Study A: r = −.42, 95% CI [−.58, −.22]
Study B: r = −.42, 95% CI [−.72, .01]
The coefficient is the same, but Study B is much less precise because the interval is wider and includes a value close to zero. A Chapter 4 discussion should treat Study B more cautiously.
Fisher’s z Transformation
For Pearson correlation, confidence intervals are often based on Fisher’s z transformation. The basic idea is that correlation coefficients are transformed to a scale that is easier to use for interval estimation, then transformed back to the correlation scale. Welz et al. (2022) discuss Fisher-transformation-based confidence intervals for correlations and their role in estimating uncertainty around correlation coefficients (Welz et al., 2022).
Students do not need to calculate Fisher’s z manually unless required by their methodology. However, they should understand that a confidence interval is not produced by basic Excel correlation output automatically. It usually requires additional formulas, an add-in, SPSS, Jamovi, JASP, R, or expert statistical support.
IBM’s SPSS Bivariate Correlations documentation identifies confidence interval settings for Pearson and Spearman correlations, which is one reason SPSS or another statistical package may be easier for dissertation reporting (IBM, n.d.).
Assumptions Students Should Check Before Trusting Excel Correlation Results
Running Excel is not enough. Students should still check whether correlation is appropriate.
For Pearson correlation, students should check correct level of measurement, paired observations, independence of observations, linearity, absence of serious outliers, missing data, correct questionnaire scoring, and approximate normality, especially in small samples.
For Spearman correlation, students should check whether variables are ordinal, ranked, skewed, non-normal, or rankable, and whether the relationship is monotonic.
Schober et al. (2018) explain that Pearson correlation is typically used for continuous data with linear relationships, while Spearman correlation is used for nonnormal, ordinal, or ranked data (Schober et al., 2018).
Excel Correlation Assumption Checklist for Nursing Students
| Assumption or condition | What to check in Excel | Why it matters |
|---|---|---|
| Correct measurement level | Are variables continuous, ordinal, or categorical? | Determines whether Pearson or Spearman may fit |
| Paired observations | Does each participant have both variables? | Correlation requires matched values |
| Independence | Does each row represent an independent participant? | Repeated or clustered data may need other methods |
| Linearity for Pearson | Does the scatterplot show a roughly straight pattern? | Pearson measures linear association |
| Monotonicity for Spearman | Does the pattern move consistently upward or downward? | Spearman measures monotonic association |
| Outliers | Are extreme points visible in the scatterplot? | Outliers can distort Pearson correlation |
| Missing data | Are there blank cells or skipped scores? | Missing data reduce valid sample size |
| Questionnaire scoring | Are total scores and reverse-coded items correct? | Wrong scoring can reverse or weaken correlation |
| Normality for Pearson | Are distributions extremely skewed? | Strong skew may make Spearman safer |
| Correct tool | Is Excel enough for the reporting requirement? | Dissertation reporting may need more than Excel |
A student who cannot justify these assumptions should avoid treating Excel output as final Chapter 4 evidence.
Missing Data Problems in Excel Correlation Analysis
Missing data can cause serious problems in Excel correlation analysis. A blank cell, skipped questionnaire response, or text entry can reduce usable cases or create range-selection errors.
If a student correlates stress score and sleep quality score, participants missing either score cannot contribute to that specific correlation. The valid n is the number of participants who have both values.
Excel may not make missing-data decisions as transparent as statistical software. A student may accidentally select ranges that include blank cells, mismatched rows, or different participants. This can produce incorrect results.
Missing Data Example
Suppose a dataset has 100 participants. Ninety-five participants completed the stress score. Ninety participants completed the sleep quality score. Only 86 participants completed both.
The valid n for the correlation between stress and sleep quality is 86, not 100, 95, or 90.
Students should check valid n, document missing-data handling, and avoid reporting results without knowing how many cases were actually included.
Common Excel Errors That Can Ruin Correlation Results
Excel is easy to use, but it is also easy to misuse.
Common errors include selecting the wrong range, including labels inside a formula range incorrectly, using mismatched ranges, including blank cells without checking valid cases, mixing text and numeric values, forgetting to reverse-code questionnaire items, correlating individual items instead of total scale scores, using Pearson for ordinal data without justification, ignoring outliers, interpreting R-squared as the correlation coefficient, confusing correlation with causation, reporting Excel output without APA formatting, and assuming Excel provides p-values automatically.
A particularly dangerous mistake is sorting only one variable column. If a student sorts stress scores but does not sort the full dataset, the participant pairing is destroyed. The correlation result becomes meaningless because each stress score is no longer matched with the correct participant’s sleep quality score.
Excel Error Prevention Table
| Error | Why it is dangerous | Better practice |
|---|---|---|
| Selecting the wrong range | Correlates the wrong variables | Check column letters and row numbers |
Including labels in CORREL ranges |
Can create formula errors | Select numeric data only |
| Selecting different row ranges | Breaks paired observations | Use equal-length ranges |
| Sorting one column only | Destroys participant matching | Sort the entire dataset by rows |
| Ignoring blank cells | Changes valid n | Count paired complete cases |
| Using R² as r | Reports the wrong statistic | Use CORREL or PEARSON |
| Using Pearson for ordinal data | May violate assumptions | Consider Spearman or another tool |
| Reporting only the coefficient | Incomplete Chapter 4 reporting | Add p-value, n, CI, and interpretation where required |
How to Report Excel Correlation Results in APA 7th Edition
APA reporting should include more than the Excel coefficient. Students should report the correlation method, variables correlated, sample size or degrees of freedom where appropriate, correlation coefficient, p-value if available, confidence interval if available or required, direction, strength, and plain-language interpretation.
APA Style guidance states that statistical symbols such as p, r, M, SD, and N are italicized, and exact p-values should generally be reported where possible, using p < .001 for very small values (American Psychological Association, 2024).
What to Report
Report the method used, such as Pearson correlation or Spearman correlation. Report the variables correlated, sample size or degrees of freedom, correlation coefficient, p-value if available, 95% confidence interval if available or required, direction, strength, plain-language interpretation, and noncausal wording.
Excel alone may not provide all of these details. If Excel produced only the coefficient, the student should not pretend that a complete statistical test was conducted.
APA Reporting Template
A Pearson correlation was conducted to examine the relationship between [Variable 1] and [Variable 2]. The results showed a [weak/moderate/strong] [positive/negative] relationship, r([df]) = [value], p = [value], 95% CI [[lower], [upper]]. This finding indicates that higher [Variable 1] scores were associated with [higher/lower] [Variable 2] scores.
If only Excel’s CORREL coefficient is available, the student should obtain the missing p-value and confidence interval where required before final Chapter 4 reporting.
Wrong vs Correct APA Reporting for Excel Users
| Weak or incorrect report | Better APA-style report |
|---|---|
| Excel showed a correlation of −.42, so stress affected sleep. | Excel’s CORREL function showed a negative correlation between stress score and sleep quality score, r = −.42. Additional analysis was needed to obtain the p-value and confidence interval before final APA reporting. |
| The correlation was significant because the number was large. | A Pearson correlation was conducted to examine the relationship between stress score and sleep quality score. The results showed a statistically significant negative relationship, r(80) = −.42, p < .001, 95% CI [−.58, −.22]. |
| Medication adherence reduced blood pressure. | Higher medication adherence scores were associated with lower systolic blood pressure, r(88) = −.48, p < .001. Causality cannot be inferred from the correlational design. |
| R² = .36, so the correlation was .36. | Excel’s displayed R² value should not be reported as the correlation coefficient. The correlation coefficient should be obtained using CORREL, PEARSON, or the correlation matrix. |
| Excel proved my hypothesis. | The correlation result supported a statistically significant association between the variables, but it did not prove cause and effect. |
APA Write-Up Examples for Excel Correlation Results
1. Pearson Correlation Calculated in Excel With Full Reporting Details Available
A Pearson correlation was conducted to examine the relationship between medication adherence score and systolic blood pressure. The results showed a statistically significant moderate negative relationship, r(88) = −.48, p < .001, 95% CI [−.62, −.30]. This finding indicates that higher medication adherence scores were associated with lower systolic blood pressure.
2. Pearson Correlation Where Excel Produced Only the Coefficient
Excel’s CORREL function showed a negative correlation between stress score and sleep quality score, r = −.42. Because the basic Excel function did not provide a p-value or confidence interval, additional statistical analysis was needed before determining whether the relationship was statistically significant for Chapter 4 reporting.
3. Non-Significant Correlation Example
A Pearson correlation was conducted to examine the relationship between age and patient satisfaction score. The results showed a weak, non-significant positive relationship, r(46) = .16, p = .274. This finding indicates that age was not significantly associated with patient satisfaction score in the sample.
4. Correlation Matrix Summary
A Pearson correlation matrix was used to examine relationships among stress score, sleep quality score, medication adherence score, and systolic blood pressure. Medication adherence score was negatively associated with systolic blood pressure, r(88) = −.48, p < .001. Stress score was negatively associated with sleep quality score, r(80) = −.44, p < .001. These findings indicate that higher adherence was associated with lower systolic blood pressure and higher stress was associated with poorer sleep quality.
5. Example Avoiding Causal Language
Incorrect:
Medication adherence reduced systolic blood pressure.
Better:
Higher medication adherence scores were associated with lower systolic blood pressure. The correlation analysis suggests an association, but causality cannot be inferred from the correlational design.
Sample Excel Correlation Table for Chapter 4
Table 3. Sample APA-Style Excel Correlation Results Table
| Variable pair | n | Correlation method | Correlation coefficient | p-value | 95% CI | Direction | Interpretation |
|---|---|---|---|---|---|---|---|
| Stress score and sleep quality score | 82 | Pearson | −.44 | < .001 | [−.60, −.25] | Negative | Higher stress was associated with poorer sleep quality |
| Medication adherence score and systolic blood pressure | 90 | Pearson | −.48 | < .001 | [−.62, −.30] | Negative | Higher adherence was associated with lower systolic blood pressure |
| Pain score and quality-of-life score | 76 | Pearson | −.39 | .001 | [−.56, −.18] | Negative | Higher pain was associated with lower quality of life |
| Patient satisfaction and communication score | 104 | Pearson | .52 | < .001 | [.37, .65] | Positive | Higher communication scores were associated with higher satisfaction |
| Burnout score and job satisfaction score | 88 | Pearson | −.46 | < .001 | [−.61, −.27] | Negative | Higher burnout was associated with lower job satisfaction |
Note. n = valid paired cases; CI = confidence interval; p = probability value. Values are examples only. If coefficients are Spearman correlations, label them as Spearman’s rho instead of Pearson’s r.
Correlation Does Not Mean Causation
Excel correlation does not prove cause and effect. A significant correlation does not mean one variable caused another.
This is especially important in cross-sectional nursing datasets. If medication adherence and systolic blood pressure are correlated, the analysis does not prove that adherence caused lower blood pressure. Other factors, such as age, comorbidities, medication type, access to care, diet, exercise, or baseline disease severity, may explain part of the relationship.
Mukaka (2012) emphasizes that correlation must be interpreted carefully and should not be used to make unsupported causal claims in medical research (Mukaka, 2012).
Use association language.
Table 4. Better Wording for Excel Correlation Results
| Incorrect wording | Better wording |
|---|---|
| Medication adherence reduced blood pressure. | Higher medication adherence scores were associated with lower systolic blood pressure. |
| Stress caused poor sleep quality. | Higher stress scores were associated with poorer sleep quality scores. |
| Pain affected quality of life. | Pain score and quality-of-life score showed a negative correlation. |
| Communication improved satisfaction. | Higher communication scores were associated with higher patient satisfaction scores. |
| Excel proved the relationship. | The correlation result suggests an association, but causality cannot be inferred. |
Excel Correlation vs SPSS, Jamovi, JASP, and R
Excel is useful, but it is not always enough for dissertation-level correlation analysis.
Table 5. Excel vs Other Tools for Correlation Analysis
| Tool | Best for | Limitations | When nursing students may use it |
|---|---|---|---|
| Excel | Simple coefficient, basic matrix, scatterplot, early exploration | Limited automatic p-values, confidence intervals, assumption checks, and APA output | Early analysis or simple Pearson checks |
| SPSS | Dissertation-friendly statistical output, p-values, matrices, common academic use | Requires correct setup and interpretation | Chapter 4 statistical reporting |
| Jamovi | User-friendly statistical output and tables | May require learning a new interface | Students who want easier statistical output |
| JASP | User-friendly statistical analysis and reporting | May require learning a new interface | Students needing clearer output than Excel |
| R | Advanced analysis, reproducibility, custom reporting | Requires coding knowledge | Complex analysis or advanced statistical support |
| Professional support | Test selection, assumptions, APA reporting, Chapter 4 writing | Requires sharing clean data and study details | Students unsure about method, output, or reporting |
IBM’s SPSS Bivariate Correlations procedure can compute Pearson, Spearman, and Kendall correlations with significance levels, and it includes confidence interval settings for Pearson and Spearman correlations (IBM, n.d.). This is why SPSS or another statistical package may be more appropriate when the committee expects full inferential reporting.
Use Excel when the analysis is simple and exploratory. Use a statistical package or expert support when the dissertation requires significance testing, confidence intervals, assumptions, missing-data handling, or defendable Chapter 4 interpretation.
How to Know Whether Excel Correlation Is Enough for Your Dissertation
Before using Excel as your final analysis tool, answer these questions:
Do I only need a simple Pearson coefficient?
Does my committee require p-values?
Do I need confidence intervals?
Do I need Spearman correlation?
Are my variables ordinal, skewed, or non-normal?
Do I have missing data?
Do I need APA-ready tables?
Do I need to justify assumptions in Chapter 3?
Do I need to write Chapter 4 results?
Am I unsure whether correlation is the right test?
Table 6. Decision Guide: Is Excel Enough for Correlation Analysis?
| Student situation | Is Excel enough? | Better option | Reason |
|---|---|---|---|
| Simple Pearson coefficient only | Usually yes | Excel CORREL |
Excel can calculate the coefficient |
| Correlation matrix without significance testing | Sometimes | Excel ToolPak | Useful for exploration |
| Committee requires p-values | Usually no | SPSS, Jamovi, JASP, R, or expert help | Basic Excel output is incomplete |
| Committee requires confidence intervals | Usually no | SPSS, Jamovi, JASP, R, or expert help | Basic Excel tools do not automatically provide them |
| Spearman correlation needed | Sometimes, but risky | SPSS, Jamovi, JASP, R, or expert help | Excel requires manual ranking |
| Missing data present | Use cautiously | SPSS or expert support | Valid n and deletion method must be clear |
| APA Chapter 4 reporting needed | Usually not alone | Statistical support or statistical software | Excel output needs interpretation |
| Unsure whether correlation is correct | No | Test-selection support | Wrong test can weaken the dissertation |
If the answer to several questions is “yes,” Excel should not be your only tool.
Getting Help With Correlation Analysis in Excel
Many nursing students can calculate a correlation coefficient in Excel but still struggle with the most important parts: choosing Pearson or Spearman, cleaning the dataset, checking assumptions, calculating p-values, interpreting the coefficient, preparing APA tables, and writing Chapter 4 results.
Nursing Dissertation Help can support students with Excel correlation analysis, Pearson correlation, Spearman correlation, correlation matrix interpretation, scatterplot interpretation, data cleaning, questionnaire scoring, missing-data handling, p-value calculation, confidence interval interpretation, SPSS, Jamovi, JASP, or R support, APA 7th reporting, Chapter 4 results writing, and dissertation statistics consultation.
If you already have an Excel dataset, questionnaire responses, SPSS output, or a Chapter 4 draft, expert support can help you confirm whether Excel is enough, choose the correct correlation test, calculate the missing statistics, and report the result clearly.
Conclusion
Learning how to do correlation analysis in Excel for nursing research can help students explore relationships between healthcare variables such as stress and sleep quality, medication adherence and blood pressure, pain and quality of life, communication and satisfaction, or burnout and job satisfaction. Excel can calculate basic Pearson correlations, produce simple correlation matrices, and create scatterplots that help students inspect relationships visually.
However, dissertation-level reporting usually requires more than a coefficient. Students may need p-values, confidence intervals, assumption checks, valid sample sizes, missing-data explanations, APA 7th tables, and careful Chapter 4 interpretation. Excel is helpful, but it does not automatically provide everything needed for a complete nursing dissertation results section.
If you want your results to be defensible, do not stop at the Excel coefficient. Get help confirming the correct test, cleaning the dataset, calculating missing statistics, checking assumptions, and writing Chapter 4 in APA 7th format. Nursing Dissertation Help can support you with Excel correlation analysis, Pearson and Spearman testing, SPSS output, APA reporting, and dissertation statistics interpretation so your final results are accurate, clear, and ready for review.
Frequently Asked Questions About Correlation Analysis in Excel
Can I do correlation analysis in Excel?
Yes. Excel can calculate Pearson correlation using the CORREL function, the PEARSON function, or the Data Analysis ToolPak. It can also create scatterplots for visual inspection. However, Excel may not automatically provide p-values, confidence intervals, assumption checks, or APA-ready reporting.
How do I calculate Pearson correlation in Excel?
Use the CORREL function. For example, if stress scores are in B2:B51 and sleep quality scores are in C2:C51, enter =CORREL(B2:B51, C2:C51) in an empty cell. Excel will return the Pearson correlation coefficient.
Can Excel do Spearman correlation?
Excel can do a Spearman-style correlation if you rank both variables first and then correlate the rank columns. However, this is manual and easier to do incorrectly. SPSS, Jamovi, JASP, R, or expert support may be safer for dissertation-level Spearman reporting.
Does Excel give p-values for correlation?
The basic CORREL function gives the correlation coefficient only. The basic ToolPak correlation matrix does not automatically provide a full APA-style result with p-values. Students may need additional formulas, statistical software, or expert support.
What is the CORREL function in Excel?
The CORREL function returns the correlation coefficient between two cell ranges. It is commonly used for Pearson correlation in Excel.
How do I create a correlation matrix in Excel?
Use the Data Analysis ToolPak. Go to Data, choose Data Analysis, select Correlation, enter the input range, choose whether variables are grouped by rows or columns, select labels if needed, and choose the output location.
How do I interpret a correlation coefficient in Excel?
A positive value means the variables tend to increase together. A negative value means one variable tends to decrease as the other increases. Values closer to −1 or +1 are stronger, while values close to 0 show weak or no linear relationship.
Can I use Excel correlation results in my dissertation?
Yes, but only if the analysis meets your methodology requirements. Many dissertations need p-values, confidence intervals, assumption checks, valid sample sizes, and APA reporting. Excel output may need additional statistical support before it is ready for Chapter 4.
When should I use SPSS instead of Excel?
Use SPSS, Jamovi, JASP, R, or expert support when you need p-values, confidence intervals, Spearman correlation, missing-data handling, assumption checks, APA-ready tables, or full Chapter 4 interpretation.
How do I report Excel correlation results in APA 7th edition?
Report the correlation method, variables, sample size or degrees of freedom, correlation coefficient, p-value if available, confidence interval if available, direction, strength, and noncausal interpretation.
References
American Psychological Association. (2024). Number and statistics guide. APA Style.
IBM. (n.d.). Bivariate correlations. IBM SPSS Statistics Documentation.
Microsoft. (n.d.-a). CORREL function. Microsoft Support.
Microsoft. (n.d.-b). PEARSON function. Microsoft Support.
Microsoft. (n.d.-c). RANK.EQ function. Microsoft Support.
Microsoft. (n.d.-d). Use the Analysis ToolPak to perform complex data analysis. Microsoft Support.
Microsoft. (n.d.-e). Present your data in a scatter chart or a line chart. Microsoft Support.
Mukaka, M. M. (2012). Statistics corner: A guide to appropriate use of correlation coefficient in medical research. Malawi Medical Journal, 24(3), 69–71.
Schober, P., Boer, C., & Schwarte, L. A. (2018). Correlation coefficients: Appropriate use and interpretation. Anesthesia & Analgesia, 126(5), 1763–1768. https://doi.org/10.1213/ANE.0000000000002864
Wasserstein, R. L., & Lazar, N. A. (2016). The ASA statement on p-values: Context, process, and purpose. The American Statistician, 70(2), 129–133. https://doi.org/10.1080/00031305.2016.1154108
Welz, T., Doebler, P., & Pauly, M. (2022). Fisher transformation based confidence intervals of correlations in fixed- and random-effects meta-analysis. British Journal of Mathematical and Statistical Psychology, 75(1), 1–22. https://doi.org/10.1111/bmsp.12242
Wisniewski, S. J., & Brannan, G. D. (2024). Correlation coefficient, partial, and Spearman rank, and regression analysis. In StatPearls. StatPearls Publishing.
