

Introduction
Many nursing students reach Chapter 3 or Chapter 4 with a dataset that contains several variables but no clear analysis direction. They may have multiple predictors, several outcomes, grouped participants, questionnaire items, demographic covariates, clinical variables, or repeated measurements. The difficulty is knowing whether to use multiple regression, logistic regression, MANOVA, factor analysis, correlation, ANOVA, or another SPSS method.
SPSS multivariate analysis helps nursing students answer research questions involving multiple variables. However, the correct method depends on the research question, outcome type, predictor type, measurement level, study design, assumptions, and reporting requirements. IBM describes logistic regression as appropriate when predicting the presence or absence of a characteristic from predictor variables, while GLM Multivariate is used when multiple dependent variables are analyzed by factors or covariates (IBM, n.d.-a; IBM, n.d.-b).
The goal is not to choose the most advanced test. The goal is to choose the correct test for the nursing research question. A strong analysis plan protects students from wrong conclusions, weak Chapter 4 interpretation, and supervisor requests for major revisions.
Need help choosing the right SPSS method for your nursing research? Our SPSS Data Analysis Help service can review your research questions, variables, dataset, and rubric to identify the correct analysis and reporting approach.
What Is SPSS Multivariate Analysis?
SPSS multivariate analysis refers to statistical methods that examine multiple variables at the same time. In nursing research, this may involve multiple predictors, multiple outcomes, several groups, questionnaire dimensions, adjusted models, or complex relationships among clinical and demographic variables.
Students often use the word “multivariate” broadly. One student may mean multiple regression with several predictors. Another may mean MANOVA with several dependent variables. Another may mean factor analysis for questionnaire items. Because of this, the first step is not opening SPSS. The first step is defining the research question.
In practical nursing research, SPSS multivariate methods may help answer questions such as:
- What predicts patient satisfaction?
- Which factors predict medication adherence?
- Do patient education groups differ across several outcomes?
- Do questionnaire items form meaningful subscales?
- Which predictors remain significant after controlling for demographics?
- Do clinical, demographic, and behavioral variables jointly explain an outcome?
The method must match the question. A strong analysis plan begins with the dependent variable or variables, not with the name of a statistical test.
Why Multivariate Analysis Matters in Nursing Research
Nursing outcomes are rarely influenced by one factor. Medication adherence may depend on knowledge, age, self-efficacy, education level, prior counseling, medication side effects, and access to care. Patient satisfaction may depend on communication, waiting time, pain control, discharge teaching, and perceived respect. Nurse burnout may relate to staffing, workload, leadership support, unit type, shift pattern, and years of experience.
Multivariate analysis helps students move beyond simple one-variable tests. It allows them to examine adjusted relationships, compare groups across several outcomes, classify cases, or explore questionnaire structure.
This matters because simple tests can give incomplete answers. A bivariate correlation may show that age relates to satisfaction, but multiple regression can show whether age still matters after controlling for communication and waiting time. A chi-square test may show that counseling relates to adherence, but logistic regression can estimate the odds of adherence while adjusting for knowledge and age.
Multivariate analysis fits within broader Types of Quantitative Data Analysis because it helps students answer more complex quantitative research questions.
Multivariate vs Multivariable: What Students Should Know
Students often confuse multivariate and multivariable analysis.
Multivariable analysis usually means one outcome is analyzed using multiple predictors. For example, multiple regression predicts one continuous outcome from several predictors. Logistic regression predicts one binary outcome from several predictors.
Multivariate analysis often means multiple outcomes are analyzed together. MANOVA is a common example because it compares groups on two or more related continuous dependent variables.
In real student work, supervisors and rubrics sometimes use these terms loosely. A supervisor may say “multivariate analysis” when they mean adjusted regression. A rubric may require “multivariate statistics” to mean any advanced method involving multiple variables.
Students should follow the terminology used in their methodology chapter, supervisor feedback, and discipline guidelines. This article uses SPSS multivariate analysis broadly because many nursing students search this phrase when they need help choosing among advanced SPSS methods.
When Do You Need Multivariate Analysis in SPSS?
You may need a multivariate method when the research question includes several predictors, multiple outcomes, adjusted effects, group comparisons across several dependent variables, classification, or questionnaire dimensions.
Use a multivariate method when:
- The study includes several predictors.
- The analysis must adjust for covariates.
- The dependent variable is binary and predictors are multiple.
- Groups are compared on several related continuous outcomes.
- A questionnaire may contain hidden factors or subscales.
- The research question involves prediction, association, classification, or group differences.
- Descriptive statistics alone cannot answer the hypothesis.
Not every nursing study needs multivariate analysis. Some studies only need frequencies, means, t-tests, chi-square tests, correlations, or ANOVA. Descriptive summaries, missing-value checks, and variable screening should happen before advanced testing. See Descriptive Data Analysis in Nursing Research for that foundation.
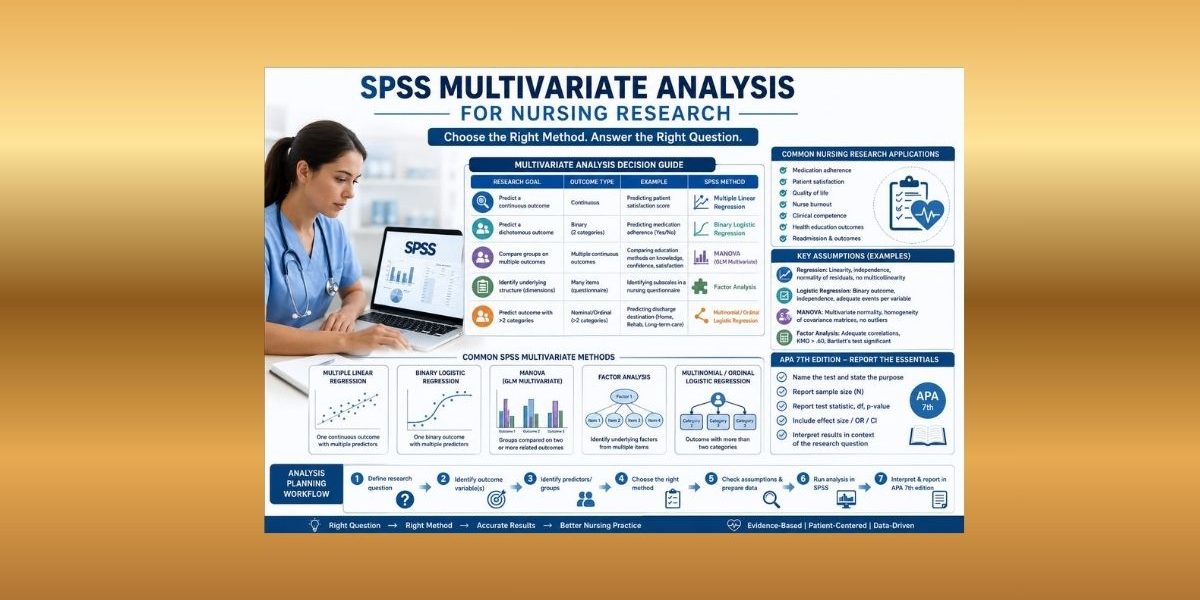
SPSS Multivariate Analysis Decision Guide
The easiest way to choose the right SPSS multivariate method is to start with the outcome and research question.
| Research Situation | Outcome Type | Common SPSS Method | Nursing Example |
|---|---|---|---|
| One continuous outcome with several predictors | Continuous | Multiple linear regression | Predicting patient satisfaction from age, wait time, communication score, and education level |
| One binary outcome with several predictors | Binary | Binary logistic regression | Predicting adherent vs non-adherent status from knowledge, self-efficacy, age, and counseling |
| Groups compared on several related continuous outcomes | Multiple continuous outcomes | MANOVA | Comparing patient education methods on knowledge, confidence, and satisfaction |
| Many questionnaire items may form subscales | Item-level questionnaire data | Exploratory factor analysis | Identifying subscales in a nursing confidence questionnaire |
| Outcome has three or more unordered categories | Nominal categorical | Multinomial logistic regression | Predicting discharge destination: home, rehabilitation, or long-term care |
| Outcome has ordered categories | Ordinal categorical | Ordinal logistic regression | Predicting low, moderate, or high risk classification |
| Same participants measured repeatedly | Repeated continuous measurements | Repeated measures ANOVA, mixed ANOVA, or mixed models | Comparing anxiety scores at baseline, post-intervention, and follow-up |
| Cases are clustered | Clustered or nested data | Mixed models or generalized estimating equations | Patients nested within wards, clinics, or hospitals |
This guide should not replace a full statistical plan, but it helps students avoid the most common mistake: choosing a method before identifying the outcome type.
How to Choose the Right SPSS Multivariate Method
If the Outcome Is Continuous and You Have Several Predictors
Use multiple linear regression when one continuous outcome is predicted by several variables. Example: predicting patient satisfaction from age, waiting time, communication score, and education level.
This method fits when the research question asks whether predictors explain or predict variation in a continuous outcome. Field’s applied SPSS text covers regression, factor analysis, and other statistical procedures commonly used in SPSS-based analysis (Field, 2024).
If the Outcome Is Binary
Use binary logistic regression when the outcome has two categories. Example: predicting medication adherence status from knowledge score, age, self-efficacy, and prior counseling.
Logistic regression in SPSS estimates odds ratios for predictors in a dichotomous outcome model (IBM, n.d.-a). For a detailed method guide, use SPSS Logistic Regression.
If You Compare Groups on Multiple Continuous Outcomes
Use MANOVA when one or more categorical group variables are compared on two or more related continuous outcomes. Example: comparing three patient education methods on knowledge, confidence, and satisfaction.
For detailed output interpretation, see SPSS MANOVA.
If You Need to Explore Questionnaire Structure
Use factor analysis when the goal is to examine how questionnaire items group into underlying dimensions. IBM notes that SPSS factor analysis provides extraction and rotation options for examining factor structure (IBM, n.d.-c). See SPSS Factor Analysis for a focused guide.
If the Outcome Has More Than Two Categories
Use multinomial logistic regression for unordered categories and ordinal logistic regression for ordered categories. For example, discharge destination may be unordered, while risk category may be ordered.
If the Same Participants Are Measured Repeatedly
Use repeated measures methods, mixed ANOVA, or mixed models depending on whether the same outcome is measured over time, whether groups are compared, and whether the data structure is balanced.
Common SPSS Multivariate Methods in Nursing Research
Multiple Linear Regression
Multiple regression is used when the outcome is continuous and predictors may be continuous or categorical. Nursing examples include predicting satisfaction score, quality-of-life score, pain score, knowledge score, burnout score, or readiness-for-discharge score.
Binary Logistic Regression
Binary logistic regression is used when the outcome has two categories, such as readmitted/not readmitted, adherent/non-adherent, improved/not improved, passed/failed, or infection present/absent.
MANOVA
MANOVA is used when groups are compared on two or more related continuous outcomes. It is useful for intervention studies, patient education studies, training evaluations, and quality improvement projects with several related outcome scores.
Factor Analysis
Factor analysis is used to explore questionnaire structure. It helps students determine whether many survey items reflect fewer underlying dimensions.
Discriminant Analysis
Discriminant analysis classifies cases into groups. In many applied health studies, logistic regression is often easier to justify and interpret, especially when the outcome is binary.
Canonical Correlation
Canonical correlation examines relationships between two sets of variables. It is less common in most nursing dissertations but may appear in advanced quantitative research.
Before Running Multivariate Analysis in SPSS
Before running any advanced SPSS procedure, clarify the research question. Then identify the dependent variable or variables. Next, identify predictors, grouping variables, covariates, repeated measures, or questionnaire items.
Check measurement levels. A continuous outcome, binary outcome, ordinal outcome, categorical outcome, and multiple dependent variables require different methods. Confirm coding and value labels. A binary variable coded incorrectly can reverse a logistic regression interpretation. A group variable without labels can make MANOVA output confusing.
Review missing values. Missing-value codes such as 99 or 999 should not be analyzed as real values. Inspect descriptive statistics, outliers, group sizes, and variable distributions.
Finally, match the method to the hypothesis. If the hypothesis asks whether age, communication score, and waiting time predict satisfaction, multiple regression may fit. Suppose it asks whether counseling predicts adherence status, logistic regression may fit. If it asks whether education methods differ on knowledge, confidence, and satisfaction, MANOVA may fit.
Data Coding and Variable Preparation
Data preparation affects every SPSS multivariate method.
Binary outcomes must be coded correctly for logistic regression. For example, adherence may be coded as 0 = non-adherent and 1 = adherent. The event category must match the research question.
Group variables must be coded clearly for MANOVA. Education method may be coded as 1 = brochure, 2 = video, and 3 = nurse-led teaching. Value labels should be entered before analysis.
Categorical predictors in regression may need dummy coding. Scale scores may need to be computed before analysis. Reverse-coded questionnaire items must be corrected before total or mean scores are created.
Missing-value codes must be defined correctly. If 99 means “missing,” SPSS should not treat 99 as an actual score. Poor coding creates poor output, even when the statistical method is correct.
Assumptions in SPSS Multivariate Analysis
Assumptions depend on the chosen method. Students should not apply one generic assumption checklist to every test.
Multiple regression commonly requires attention to linearity, independent observations, residual patterns, multicollinearity, outliers, and model specification.
Logistic regression requires a binary outcome, independent observations, correct coding of the event, appropriate predictor coding, adequate outcome events, and no severe multicollinearity.
MANOVA requires categorical grouping variables, multiple continuous dependent variables, related but distinct outcomes, independent observations, multivariate normality, no severe multivariate outliers, and homogeneity of covariance matrices.
Factor analysis requires suitable item correlations, adequate sample size, meaningful item structure, and careful extraction and rotation decisions. Tabachnick and Fidell emphasize the importance of matching multivariate procedures to variable type, assumptions, missing data, outliers, and the suitability of the data for the selected method (Tabachnick & Fidell, 2019).
The key lesson is simple: choose the method first, then check the assumptions for that method. Do not use one universal checklist for every analysis.
How to Avoid Choosing the Wrong SPSS Test
Use this workflow before running any multivariate data analysis in SPSS:
- Write the research question.
- Identify the dependent variable.
- Identify predictors, groups, covariates, repeated measures, or questionnaire items.
- Check whether the outcome is continuous, binary, ordinal, categorical, or multiple outcomes.
- Choose the method based on the outcome and research question.
- Prepare and code variables.
- Run descriptive checks.
- Check assumptions for the selected method.
- Run only the SPSS procedure that matches the question.
- Interpret the output tables relevant to that method.
- Report results in APA 7th edition format.
- Connect findings back to the nursing research question.
This workflow prevents a common mistake: choosing a statistical test because it sounds advanced instead of because it matches the research design.
SPSS Output: What Students Should Not Ignore
Do not report every SPSS table automatically. Identify the table that answers the main research question.
For regression, focus on model fit, coefficients, p-values, confidence intervals, and assumption checks. In logistic regression, focus on the modeled event, odds ratios, confidence intervals, and model fit. For MANOVA, focus on the multivariate test, assumption checks, follow-up tests, and effect sizes and in factor analysis, focus on suitability tests, extraction, rotation, factor loadings, and conceptual meaning.
Students should also check sample size and excluded cases. Missing data can change the analysis sample. Output interpretation should include p-values, effect sizes, odds ratios, confidence intervals, or factor loadings where appropriate.
Statistical significance does not automatically mean clinical importance. A small statistically significant effect may not change practice. A non-significant result may still be important if the sample is small or the confidence interval is wide. For support with p-values, effect sizes, confidence intervals, predictors, and interpretation, students can use Inferential Statistics Help for Nursing Research.
Examples of SPSS Multivariate Analysis in Nursing Research
Example 1: Multiple Regression
A student predicts patient satisfaction from age, waiting time, communication score, and education level.
Multiple regression fits because the outcome is continuous and the study includes several predictors. The student should report the overall model, R², F test, coefficients, confidence intervals, p-values, and interpretation of significant predictors.
Example 2: Logistic Regression
A student predicts medication adherence status from knowledge score, self-efficacy, age, and prior counseling.
Logistic regression fits because the outcome is binary. The student should report model fit, odds ratios, confidence intervals, p-values, and whether each predictor increased or decreased the odds of adherence.
Example 3: MANOVA
A student compares three patient education methods on knowledge, confidence, and satisfaction scores.
MANOVA fits because the study compares groups on multiple related continuous outcomes. The student should report the multivariate test, effect size, follow-up univariate tests, post hoc comparisons when needed, and direction of group differences.
Example 4: Factor Analysis
A student examines whether a 20-item nursing confidence questionnaire contains meaningful subscales.
Factor analysis fits because the goal is to examine questionnaire structure and identify underlying dimensions. The student should report extraction method, rotation method, number of factors, factor loadings, and conceptual names for the factors.
These examples show why method selection begins with the research question and outcome type.
Common Mistakes in SPSS Multivariate Analysis
Common mistakes include:
- Choosing a method before defining the research question
- Using MANOVA when there is only one outcome
- Using linear regression for a binary outcome
- Using logistic regression for a continuous outcome
- Running factor analysis on unrelated questionnaire items
- Ignoring coding and missing-value problems
- Including too many predictors for the sample size
- Ignoring multicollinearity
- Reporting every SPSS table without interpretation
- Treating statistical significance as clinical importance
- Confusing multivariable and multivariate terminology
- Ignoring supervisor, rubric, or methodology requirements
Choosing the wrong SPSS method can weaken an otherwise strong dissertation. Our Dissertation Data Analysis Help service can review your variables, hypotheses, output, and rubric to confirm the right analysis and reporting approach.
How to Report SPSS Multivariate Analysis in APA 7th Edition
APA-style reporting depends on the method, but the same principles apply. Name the statistical method, state the purpose, identify dependent and independent variables, report sample size, report the main test statistic, include degrees of freedom where applicable, report p-values correctly, include effect sizes or confidence intervals where appropriate, and interpret results in relation to the research question.
APA Style guidance recommends reporting exact p-values when possible and using p < .001 rather than p = .000 when values are smaller than .001 (American Psychological Association, 2024).
Multiple Regression APA Reporting Example
A multiple linear regression was conducted to examine whether age, communication score, and waiting time predicted patient satisfaction. The overall model was statistically significant, F(3, 146) = 18.62, p < .001, and explained 27% of the variance in patient satisfaction, R² = .27. Communication score was a significant positive predictor of satisfaction, B = 0.48, SE = 0.09, β = .42, p < .001, 95% CI [0.30, 0.66]. Waiting time was a significant negative predictor, B = -0.21, SE = 0.07, β = -.24, p = .004, 95% CI [-0.35, -0.07]. Age was not a statistically significant predictor, p = .218.
Logistic Regression APA Reporting Example
A binary logistic regression was conducted to examine whether medication knowledge, self-efficacy, age, and prior counseling predicted medication adherence status. The overall model was statistically significant, χ²(4) = 24.38, p < .001. Prior counseling was associated with higher odds of adherence, OR = 2.45, 95% CI [1.36, 4.42], p = .003, controlling for medication knowledge, self-efficacy, and age. Medication knowledge was also a significant predictor, OR = 1.18, 95% CI [1.06, 1.31], p = .002.
MANOVA APA Reporting Example
A one-way MANOVA was conducted to examine whether patient education method differed across medication knowledge, adherence confidence, and satisfaction scores. The multivariate effect of education method was statistically significant, Pillai’s Trace = .24, F(6, 292) = 6.21, p < .001, partial η² = .11. Follow-up univariate tests indicated significant group differences in medication knowledge, F(2, 147) = 8.42, p < .001, partial η² = .10, and adherence confidence, F(2, 147) = 6.15, p = .003, partial η² = .08. The group difference in satisfaction was not statistically significant, p = .151.
Factor Analysis APA Reporting Example
An exploratory factor analysis was conducted to examine the underlying structure of a 20-item nursing confidence questionnaire. Principal axis factoring with oblique rotation was used because the factors were expected to correlate. The analysis supported a three-factor solution representing clinical communication, medication confidence, and patient education confidence. Items with loadings of .40 or higher were retained on their primary factor, and the three factors accounted for 58% of the total variance. Factor labels were assigned based on item content and theoretical meaning.
Students must replace all placeholder values with exact SPSS output. The purpose of APA reporting is not to paste raw SPSS tables but to explain what the results mean for the nursing research question.
When SPSS Multivariate Analysis May Not Be Enough
SPSS multivariate analysis may not be enough when the study design is more complex than standard procedures can handle.
More advanced support may be needed when:
- Repeated observations are nested within participants.
- Patients are clustered within hospitals, wards, clinics, or providers.
- Longitudinal data have unequal time intervals.
- Missing data are extensive.
- The outcome is count-based, time-to-event, highly skewed, or non-normal.
- The study requires prediction model validation.
- The design includes mediation, moderation, or structural equation modeling.
Possible alternatives include mixed models, generalized linear models, survival analysis, mediation analysis, moderation analysis, or structural equation modeling. Do not force a simple SPSS method onto a complex design if the method does not match the data structure.
When to Get Help With SPSS Multivariate Analysis
Students may need help when they are unsure which SPSS test matches the research question. Help is also useful when the dataset includes several predictors, several outcomes, unclear coding, missing values, assumption problems, or confusing SPSS output.
Expert support may be necessary when a supervisor requests a different method, the rubric requires APA 7th edition reporting, or Chapter 3 must justify the analysis choice. Students may also need help connecting statistical findings to nursing practice, patient outcomes, healthcare policy, or quality improvement.
SPSS Data Analysis Help can support method selection, SPSS output interpretation, assumptions, and APA reporting. Broader Dissertation Data Analysis Help can support full results chapter writing, supervisor revisions, and complete quantitative analysis.
Conclusion
SPSS multivariate analysis helps nursing and healthcare students answer complex research questions involving multiple predictors, outcomes, groups, questionnaire items, or adjusted relationships. It is useful for studies on medication adherence, readmission, patient satisfaction, clinical competence, burnout, quality of life, education outcomes, and nursing practice improvement.
The most important step is not clicking an SPSS menu. The most important step is choosing the correct method based on the research question, outcome type, predictor type, measurement level, assumptions, sample size, and reporting requirements. A strong analysis plan protects the student from wrong tests, weak interpretation, and unclear APA reporting.
Need help choosing, running, or reporting SPSS multivariate analysis? Upload your research questions, dataset, variable list, SPSS output, and rubric through our SPSS Data Analysis Help page for method selection, interpretation, and APA-style reporting support.
FAQs
What is SPSS multivariate analysis?
SPSS multivariate analysis refers to statistical methods that examine multiple variables at the same time, such as multiple regression, logistic regression, MANOVA, and factor analysis.
When should I use multivariate analysis in SPSS?
Use multivariate analysis when your research question includes multiple predictors, multiple outcomes, adjusted models, group comparisons across several outcomes, or questionnaire dimensions.
What is the difference between multivariate and multivariable analysis?
Multivariable analysis usually means one outcome with multiple predictors. Multivariate analysis often means multiple outcomes analyzed together. Students should follow the terminology used by their supervisor and methodology chapter.
Which SPSS multivariate method should I use?
Choose the method based on the outcome and research question. Use multiple regression for a continuous outcome, logistic regression for a binary outcome, MANOVA for multiple continuous outcomes across groups, and factor analysis for questionnaire structure.
How do I report SPSS multivariate analysis in APA 7th edition format?
Report the method, variables, sample size, main test statistic, degrees of freedom where applicable, p-value, effect size or odds ratio, confidence intervals where available, and interpretation linked to the nursing research question.
References
American Psychological Association. (2024). Numbers and statistics guide: APA Style 7th edition. APA Style
Field, A. (2024). Discovering statistics using IBM SPSS Statistics (6th ed.). SAGE Publications. SAGE Publications
IBM. (n.d.-a). Logistic regression. IBM Documentation. Retrieved June 18, 2026, from IBM Documentation
IBM. (n.d.-b). GLM multivariate analysis. IBM Documentation. Retrieved June 18, 2026, from IBM Documentation
IBM. (n.d.-c). Factor analysis. IBM Documentation. Retrieved June 18, 2026, from IBM Documentation
Tabachnick, B. G., & Fidell, L. S. (2019). Using multivariate statistics (7th ed.). Pearson. Pearson
