

Introduction
Many nursing students collect quantitative data but still struggle to choose the correct statistical test. You may have stress scores, sleep-quality scores, medication-adherence scores, burnout scores, blood pressure readings, patient-satisfaction ratings, nurse-communication scores, or health-literacy scores. However, the difficult question is often not whether you have data. The difficult question is whether your research question requires correlation, chi-square, regression, a t-test, ANOVA, or a paired test.
This matters because the wrong test can weaken Chapter 3 methodology, confuse Chapter 4 results, and create problems during committee review. A nursing student may ask:
Does academic stress relate to sleep quality among nursing students?
Is medication adherence associated with blood pressure control?
Does nurse workload relate to burnout?
Is patient satisfaction related to perceived nurse communication?
Is health literacy associated with diabetes self-management behavior?
These are relationship-based questions. They neither ask whether two groups are different nor ask whether three or more groups differ in mean scores. They do not test whether scores changed from pretest to posttest. Instead, they ask whether two variables are associated.
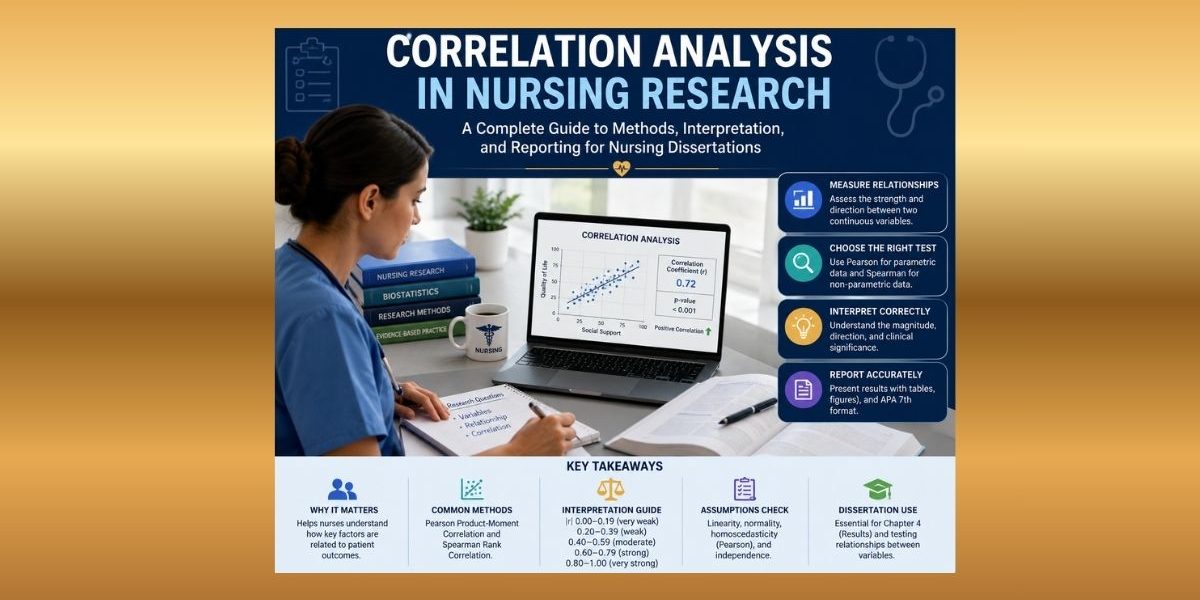
That is where correlation analysis in nursing research becomes useful. Correlation analysis helps nursing, healthcare, public health, and health sciences students examine the direction and strength of a relationship between variables. It is especially common in dissertations, capstone projects, DNP projects, theses, evidence-based practice projects, quantitative research assignments, and Chapter 4 results sections.
However, correlation analysis must be used carefully. A statistically significant correlation does not prove that one variable caused another variable. Medical and statistical sources warn that correlation can be misused when researchers ignore causation limits, assumptions, outliers, variable type, sample size, or clinical meaning (Mukaka, 2012; Schober et al., 2018).
This guide explains what correlation analysis is, when nursing students should use it, when they should avoid it, how to choose between Pearson and Spearman correlation, how to interpret correlation coefficients and p-values, how to use scatterplots and correlation matrices, and how to report results in APA 7th edition.
For broader statistical-test selection, you may also review Statistical Tests in Nursing Research, Inferential Data Analysis in Nursing Research, and Types of Data Analysis in Quantitative Research.
Key Takeaways
Correlation analysis examines whether two variables are related.
The correlation coefficient shows direction and strength.
The p-value shows statistical significance, not the size or importance of the relationship.
Pearson correlation is usually used for continuous variables with a linear relationship.
Spearman correlation is often better for ordinal, ranked, skewed, or non-normal data.
Correlation does not prove causation.
Scatterplots help detect outliers, nonlinearity, clusters, and unusual data patterns.
APA reporting should include the test used, coefficient, p-value, sample size or degrees of freedom, direction, strength, and interpretation. Chapter 3 should justify the test choice. Chapter 4 should report the results, while Chapter 5 should discuss meaning, limitations, and noncausal implications.
What Is Correlation Analysis in Nursing Research?
Correlation analysis is a statistical method used to examine the direction and strength of a relationship between variables. In most nursing dissertations, correlation analysis examines two variables at a time, such as stress and sleep quality, medication adherence and blood pressure, or nurse burnout and job satisfaction.
The result is usually a correlation coefficient. Common correlation coefficients include Pearson’s r, Spearman’s rho, Kendall’s tau, the point-biserial correlation, and the phi coefficient. Pearson correlation is commonly used for continuous variables when the relationship is linear. Spearman correlation is commonly used when variables are ordinal, ranked, skewed, or better understood as a monotonic relationship rather than a strictly linear relationship (Schober et al., 2018; Wisniewski & Brannan, 2024).
A correlation coefficient usually ranges from −1 to +1.
A positive correlation means both variables tend to increase together. For example, higher nurse workload scores may be associated with higher burnout scores.
A negative correlation means one variable tends to increase as the other decreases. For example, higher medication adherence scores may be associated with lower systolic blood pressure.
A zero or near-zero correlation means there is little or no detectable relationship in the sample.
A nursing student should interpret correlation using four ideas:
Direction: Is the relationship positive or negative?
Strength: Is the relationship weak, moderate, strong, or very strong?
Statistical significance: Is the relationship statistically significant under the null hypothesis?
Clinical or practical meaning: Does the relationship matter for nursing practice, education, patient care, safety, quality improvement, or healthcare decision-making?
A complete interpretation does not stop at “significant” or “not significant.” It explains what the coefficient means in the nursing context.
Why Correlation Analysis Matters in Nursing and Healthcare Studies
Correlation analysis matters because many nursing and healthcare studies are observational, survey-based, cross-sectional, retrospective, or non-experimental. In these designs, the researcher often measures naturally occurring variables instead of manipulating an intervention.
For example, a nursing student may study whether:
Pain intensity is related to quality of life.
Burnout is related to job satisfaction.
Medication adherence is related to blood pressure.
Sleep quality is related to academic stress.
Patient satisfaction is related to perceived nurse communication.
Anxiety is related to postoperative recovery.
Health literacy is related to self-care behavior.
Social support is related to depression scores.
These topics are common because nursing research often studies real patients, students, nurses, families, or healthcare systems in real-world settings. In many cases, it would be unethical or impractical to manipulate stress, pain, medication adherence, staffing burden, anxiety, or health literacy. Instead, the student measures variables and examines whether they are associated.
Correlation analysis is especially useful when the research question uses wording such as:
What is the relationship between…?
Is there an association between…?
Are the variables correlated?
To what extent are two variables related?
However, correlation analysis is not automatically correct just because two variables appear in the study. The test must match the research question, variable type, data pattern, and assumptions.
Correlation Does Not Mean Causation
This is one of the most important rules in correlation analysis: correlation does not prove causation.
A significant correlation means two variables are related in the sample. It does not prove that one variable caused the other. BMJ’s statistics guidance explains that correlation concerns association, and that a third variable may explain or influence an observed relationship (BMJ, n.d.).
This warning is especially important in nursing dissertations because many student projects use cross-sectional surveys. Cross-sectional data are collected at one point in time, which makes it difficult to prove which variable came first. Observational research may also be affected by confounding variables, reverse direction, measurement error, and unmeasured contextual factors.
The STROBE Statement was developed to improve reporting of observational studies, including cross-sectional studies, cohort studies, and case-control studies (STROBE, n.d.). This matters for nursing students because many correlational studies are observational. A student should clearly report the design, variables, statistical methods, limitations, and interpretation so readers understand that the findings show association rather than proof of cause and effect.
Why a Significant Correlation Does Not Prove Cause and Effect
A correlation may exist for several reasons.
Variable A may influence variable B.
Variable B may influence variable A.
A third variable may influence both A and B.
The relationship may be distorted by outliers, selection bias, measurement error, or sample characteristics.
For example, suppose a nursing student finds a negative correlation between academic stress and sleep quality. The student should not write:
Incorrect: Academic stress caused poor sleep quality.
That statement is too strong. Poor sleep may increase stress. Stress may reduce sleep quality. Work hours, caregiving responsibilities, financial pressure, anxiety, depression, academic workload, or clinical placement demands may affect both stress and sleep.
Better wording includes:
Higher academic stress scores were associated with poorer sleep quality.
Academic stress and sleep quality showed a statistically significant negative relationship.
The findings suggest an association between stress and sleep quality, but causality cannot be inferred from this correlation analysis.
Another example:
Incorrect: Poor nurse communication caused low patient satisfaction.
Better: Lower perceived nurse communication scores were associated with lower patient satisfaction scores.
Better: Patient satisfaction and perceived nurse communication showed a statistically significant positive relationship.
This wording protects the student from overstating findings in Chapter 4 and Chapter 5.
Types of Correlation Used in Nursing Research
Nursing students should not automatically choose Pearson correlation. The correct correlation test depends on the research question, measurement level, distribution, pattern of relationship, and assumptions.
Table 1. Types of Correlation Analysis Used in Nursing Research
| Correlation type | Best used when | Variable type | Nursing research example | Common caution |
|---|---|---|---|---|
| Pearson correlation | Two variables are continuous and the relationship is approximately linear | Continuous/scale variables | Stress score and sleep quality score | Sensitive to outliers, nonlinearity, and non-normal patterns |
| Spearman rank-order correlation | Variables are ordinal, ranked, skewed, or monotonic rather than linear | Ordinal, ranked, or non-normal scale variables | Satisfaction rating and perceived communication rating | Still requires a monotonic relationship |
| Kendall’s tau | Data are ordinal, sample is small, or there are many tied ranks | Ordinal/ranked variables | Symptom severity rank and recovery rank | Less commonly used in student dissertations, but useful in some ordinal datasets |
| Point-biserial correlation | One variable is dichotomous and the other is continuous | Binary + continuous | Readmission status and quality-of-life score | Binary coding must be clear and meaningful |
| Phi coefficient | Both variables are dichotomous | Binary + binary | Vaccinated/not vaccinated and readmitted/not readmitted | Chi-square is often reported with categorical association |
| Canonical correlation analysis | Two sets of variables are examined together | Two multivariable sets | Nurse work environment variables related to patient outcome variables | Advanced method requiring strong justification and adequate sample size |
Akoglu’s medical guide emphasizes that different correlation coefficients serve different purposes and that researchers should clearly report the type, direction, and strength of the selected correlation coefficient (Akoglu, 2018).
Pearson Correlation Analysis in Nursing Research
Pearson correlation is one of the most common correlation tests in nursing dissertations. It is used when both variables are continuous and the relationship is approximately linear. Pearson correlation produces Pearson’s r, a coefficient ranging from −1 to +1.
A nursing student may use Pearson correlation to examine the relationship between:
Medication adherence score and systolic blood pressure.
Burnout score and job satisfaction score.
Academic stress score and sleep quality score.
Pain intensity score and quality-of-life score.
Health literacy score and diabetes self-management score.
Pearson correlation is most defensible when both variables are measured at an interval or ratio level, paired observations are available from the same participants, the relationship is linear, and serious outliers are absent. Schober et al. explain that Pearson correlation is commonly used for linear relationships, while Spearman correlation is more suitable for nonnormally distributed continuous data, ordinal data, or data affected by relevant outliers (Schober et al., 2018).
Nursing Mini-Example: When Pearson Fits
A DNP student collects data from 90 adults with hypertension. Each participant has a medication-adherence score and a systolic blood pressure reading. Both variables are numerical. A scatterplot shows a roughly downward linear pattern. There are no extreme outliers.
In this case, Pearson correlation may be appropriate.
A possible interpretation could be:
Higher medication adherence scores were associated with lower systolic blood pressure.
When Pearson May Not Be Appropriate
Pearson correlation may be inappropriate when:
One or both variables are ordinal.
The relationship is curved rather than linear.
The data are heavily skewed.
A few extreme outliers drive the result.
The sample size is very small.
The variables are measured unreliably.
For example, if a satisfaction variable is measured using a single 1–5 Likert item, Spearman correlation may be more defensible than Pearson. If a scatterplot shows a curved relationship between pain and quality of life, Pearson may understate or misrepresent the relationship.
Spearman Correlation Analysis in Nursing Research
Spearman correlation is a rank-based correlation test. It is useful when variables are ordinal, ranked, skewed, or not appropriate for Pearson correlation. Spearman correlation measures whether two variables have a monotonic relationship. A monotonic relationship means that as one variable increases, the other variable generally increases or generally decreases, but the pattern does not have to form a perfect straight line.
Spearman correlation produces Spearman’s rho, often written as rs or ρ.
Spearman correlation is often useful in nursing datasets because many student projects use:
Likert-type satisfaction ratings.
Ordinal pain ratings.
Symptom severity rankings.
Adherence categories.
Skewed quality-of-life scores.
Non-normal stress, anxiety, or depression scores.
Official IBM SPSS Bivariate Correlations documentation identifies Pearson’s correlation coefficient, Spearman’s rho, and Kendall’s tau-b as bivariate correlation options and notes that Spearman’s rho and Kendall’s tau-b may be used with quantitative variables or ordered categories (IBM, n.d.-a).
Nursing Mini-Example: When Spearman Fits
A master’s nursing student examines the relationship between perceived stress and sleep quality among nursing students. Sleep quality is measured using an ordinal rating from 1 to 5, and stress scores are skewed. A scatterplot suggests that higher stress generally corresponds with poorer sleep quality, but the pattern is not clearly linear.
In this case, Spearman correlation may be more defensible than Pearson.
A possible interpretation could be:
Higher perceived stress was associated with poorer sleep quality ratings.
Important Spearman Caution
Spearman is not a shortcut that eliminates all assumptions. The student still needs paired observations, independent observations, appropriate variable coding, enough data, and a monotonic relationship. If the relationship is random, clustered, U-shaped, or heavily affected by unusual values, Spearman may still be misleading.
Canonical Correlation Analysis: Advanced Use Only
Canonical correlation analysis is an advanced correlation method used to examine the relationship between two sets of variables. It does not simply correlate one variable with another variable. Instead, it examines relationships between variable sets.
For example, a researcher may examine whether a set of nurse work environment variables is related to a set of patient outcome variables.
Set 1: staffing adequacy, workload, leadership support, emotional exhaustion.
Set 2: patient satisfaction, medication errors, fall risk, readmission risk.
IBM’s nonlinear canonical correlation documentation explains that canonical correlation methods analyze relationships between sets of variables rather than only relationships between individual variables (IBM, n.d.-b).
Most undergraduate, master’s, and DNP nursing projects should not use canonical correlation unless the research question, sample size, committee expectations, and statistical expertise support a multivariate approach. For most students, Pearson, Spearman, chi-square, t-tests, ANOVA, or regression will be more appropriate.
When Should Nursing Students Use Correlation Analysis?
Nursing students should use correlation analysis when the research question asks about a relationship, association, or correlation between variables.
Correlation analysis is appropriate when:
The same participants provide data for both variables.
The variables are measured numerically, ordinally, or dichotomously depending on the specific correlation test.
The goal is to examine association rather than group differences. The goal is not to test pretest-posttest change or mainly to predict an outcome using multiple predictors.
The study design is observational, cross-sectional, survey-based, retrospective, or non-experimental.
The student can interpret the result without claiming causation.
Good correlation research questions include:
What is the relationship between nurse burnout and job satisfaction?
Is medication adherence associated with systolic blood pressure among adults with hypertension?
What is the relationship between academic stress and sleep quality among nursing students?
Is patient satisfaction related to perceived nurse communication?
What is the relationship between health literacy and diabetes self-management behavior?
What is the relationship between perceived social support and depression scores among older adults?
The key phrase is relationship. If the research question asks whether two measured variables move together, correlation may be appropriate.
When Correlation Analysis Is Not the Right Test
Correlation analysis is not appropriate for every quantitative nursing question. Many students choose correlation because it seems easy, but the research question may require another test.
Table 2. When Correlation Is Not the Right Test
| Research goal | Example nursing question | Better test | Why correlation is not enough |
|---|---|---|---|
| Compare two groups | Do intervention and control groups differ in mean anxiety scores? | Independent-samples t-test or Mann–Whitney U | The question compares groups |
| Compare three or more groups | Do burnout scores differ across ICU, medical-surgical, and emergency nurses? | ANOVA or Kruskal–Wallis | The question compares more than two groups |
| Compare pretest and posttest scores | Did knowledge scores improve after patient education? | Paired t-test or Wilcoxon signed-rank | The question tests change over time |
| Examine two categorical variables | Is smoking status associated with readmission category? | Chi-square or Fisher’s exact test | Both variables are categorical |
| Predict an outcome from several predictors | Do workload, years of experience, and shift type predict burnout? | Regression | The question involves prediction and multiple predictors |
| Test agreement | Do two nurse raters agree on wound classification? | Kappa or intraclass correlation | Agreement is different from association |
Correlation is useful for association. It is not a substitute for every statistical test.
Examples of Correlation Research Questions in Nursing
Strong correlation research questions identify the variables clearly and avoid causal wording.
Table 3. Examples of Correlation Research Questions in Nursing
| Research question | Variable 1 | Variable 2 | Possible test | Why |
|---|---|---|---|---|
| What is the relationship between nurse burnout and job satisfaction? | Burnout score | Job satisfaction score | Pearson or Spearman | Both may be scale scores |
| Is medication adherence associated with blood pressure? | Adherence score | Systolic blood pressure | Pearson or Spearman | Two measured variables |
| What is the relationship between sleep quality and academic stress? | Sleep quality score | Stress score | Pearson or Spearman | Common questionnaire-score relationship |
| Is patient satisfaction related to nurse communication? | Satisfaction rating | Communication rating | Spearman or Pearson | Often ordinal or composite scale data |
| What is the relationship between pain intensity and quality of life? | Pain score | Quality-of-life score | Spearman or Pearson | Pain scores may be ordinal or skewed |
| Is health literacy associated with diabetes self-management behavior? | Health literacy score | Self-management score | Pearson or Spearman | Two scale variables |
| What is the relationship between social support and depression scores? | Social support score | Depression score | Pearson or Spearman | Two psychosocial scale variables |
A student may call one variable an independent variable and another variable a dependent variable in the research framework. However, the correlation result itself should still be interpreted as association unless the design supports causal inference.
Variables Suitable for Correlation Analysis
Correlation analysis can be used with several types of nursing variables depending on the test.
Suitable variables may include:
Continuous variables such as age, blood pressure, BMI, length of stay, knowledge score, dosage, or total scale score.
Ordinal variables such as pain ratings, satisfaction ratings, severity levels, or Likert-type responses.
Ranked variables such as symptom severity ranks or priority rankings.
Dichotomous variables such as readmission status, adherence status, or yes/no exposure variables.
Composite questionnaire scores such as stress, anxiety, depression, burnout, self-care, satisfaction, adherence, health literacy, and quality-of-life scores.
A common nursing issue involves Likert scales. A single Likert item, such as “Rate your satisfaction from 1 to 5,” is ordinal. A summed or averaged score from several Likert items is often treated as a scale variable in many applied studies, but the student should still inspect distribution, reliability, scoring, and committee expectations.
Table 4. Nursing Variables and Possible Correlation Tests
| Variable 1 | Variable 2 | Measurement level | Possible test | Reason |
|---|---|---|---|---|
| Age | Systolic blood pressure | Continuous + continuous | Pearson | Both are numerical; check linearity and outliers |
| Stress score | Sleep quality score | Scale + scale | Pearson or Spearman | Use Pearson if assumptions fit; Spearman if skewed or ordinal |
| Pain rating | Quality-of-life score | Ordinal/scale + scale | Spearman or Pearson | Pain may be ordinal or non-normal |
| Readmission status | Satisfaction score | Dichotomous + continuous | Point-biserial | One binary variable and one continuous variable |
| Adherence category | Blood pressure control status | Categorical + categorical | Chi-square or phi | Both may be categorical |
| Burnout score | Job satisfaction score | Scale + scale | Pearson or Spearman | Common workforce relationship |
| Symptom severity rank | Recovery rank | Ranked + ranked | Spearman or Kendall | Rank-based relationship |
Assumptions of Correlation Analysis
Assumption checking is one of the most important parts of correlation analysis in nursing research. It helps the student defend the test choice in Chapter 3 and explain the results accurately in Chapter 4.
The assumptions depend on the selected test, but common issues include:
Correct level of measurement.
Independent observations.
Paired observations.
Linearity for Pearson correlation.
Monotonicity for Spearman correlation.
Approximate normality or bivariate normality for Pearson correlation.
Absence of serious outliers.
Adequate sample size.
Reliable measurement of variables.
Correct questionnaire scoring.
Official IBM SPSS documentation states that researchers should screen data for outliers and evidence of a linear relationship before calculating a correlation coefficient, and that Pearson’s correlation coefficient assumes bivariate normality (IBM, n.d.-a).
How Nursing Students Can Check Assumptions
Students can check assumptions using:
Descriptive statistics.
Histograms.
Boxplots.
Scatterplots.
Normality tests.
Missing-data review.
Outlier review.
Questionnaire scoring review.
Reliability analysis when using multi-item scales.
For example, before correlating burnout and job satisfaction, the student should check whether both scale scores are correctly calculated, whether missing items were handled consistently, whether outliers exist, and whether the scatterplot suggests a linear or monotonic pattern.
What to Do When Assumptions Fail
This is where many students need practical guidance.
If both variables are continuous and the scatterplot is roughly linear, Pearson correlation may be appropriate. If variables are ordinal, skewed, ranked, or nonnormally distributed, Spearman correlation may be more appropriate. Suppose the relationship is monotonic but not linear, Spearman may be better than Pearson. And if the relationship is neither monotonic nor linear, correlation may not answer the question well. If both variables are categorical, chi-square or phi may be more appropriate. If a few outliers distort the result, the student should inspect them, verify whether they are data-entry errors, justify any correction or exclusion, and consider reporting a sensitivity analysis. Say the goal is prediction with several variables, regression may be more appropriate. If the goal is group comparison, use a t-test, ANOVA, or nonparametric alternative.
Table 5. Assumption Problems and Better Decisions
| Problem found | Why it matters | Better decision |
|---|---|---|
| Variables are ordinal | Pearson may not fit the measurement level | Consider Spearman or Kendall |
| Scatterplot is curved | Pearson measures linear association | Consider Spearman only if monotonic; otherwise reconsider the analysis |
| Extreme outlier is present | One case may distort the coefficient | Verify data, inspect influence, report handling clearly |
| Variables are heavily skewed | Pearson may be misleading | Consider Spearman or a justified transformation |
| Two variables are categorical | Correlation may not match the question | Consider chi-square, phi, or logistic regression |
| Multiple predictors are involved | Correlation cannot control covariates | Consider regression |
| Pretest-posttest design | Correlation does not test change | Consider paired t-test or Wilcoxon signed-rank |
| Scale scoring is incorrect | Results become invalid | Correct scoring before analysis |
This decision guidance is essential for dissertation defense. A committee may not only ask what test you used. They may ask why that test was appropriate.
Scatterplots and Correlation Analysis
A scatterplot is a graph that displays the relationship between two variables. It is one of the simplest and most important tools for correlation analysis.
A scatterplot helps students see:
Direction of the relationship.
Strength of the relationship.
Linearity.
Monotonic pattern.
Outliers.
Clusters.
Unusual values.
Non-linear patterns.
For Pearson correlation, the scatterplot should show an approximately linear pattern. IBM SPSS documentation specifically advises screening for outliers and evidence of a linear relationship before calculating a correlation coefficient (IBM, n.d.-a).
Nursing Mini-Example: Why Scatterplots Matter
A student finds r = .48 between age and systolic blood pressure. At first, this looks like a moderate positive relationship. However, the scatterplot shows that one unusually old participant has extremely high blood pressure and is driving much of the association.
Without the scatterplot, the student may overstate the relationship.
With the scatterplot, the student can investigate whether the value is accurate, whether the case should remain, and whether the interpretation needs caution.
A statistically significant correlation should not be interpreted from the p-value alone. The visual pattern matters.
For more background on summarizing variables before inferential testing, students may review Descriptive Data Analysis in Nursing Research.
How to Interpret the Correlation Coefficient
A correlation coefficient has three main parts:
Direction.
Strength.
Statistical significance.
The direction comes from the sign. A positive coefficient means that as one variable increases, the other tends to increase. A negative coefficient means that as one variable increases, the other tends to decrease.
The strength comes from the absolute value. A correlation of −.60 is stronger than a correlation of +.20 because .60 is farther from zero. The negative sign only shows direction. It does not mean the relationship is weaker or less important.
The statistical significance comes from the p-value. It indicates whether the observed relationship is statistically significant under the null hypothesis.
Cohen’s commonly cited effect-size guidelines are often summarized as correlations of approximately .10, .30, and .50 representing small, medium, and large effects. However, effect-size interpretation should not be treated as universal because context, measurement quality, sample size, and field expectations matter (Brydges, 2019).
Table 6. General Guide for Interpreting Correlation Coefficients
| Correlation coefficient | General strength | Interpretation caution | Nursing example |
|---|---|---|---|
| 0 to ±.09 | Very weak or negligible | May not be meaningful even if significant in a large sample | Age has almost no relationship with satisfaction score |
| ±.10 to ±.29 | Weak | May matter if the outcome is clinically important | Weak association between health literacy and appointment adherence |
| ±.30 to ±.49 | Moderate | Often meaningful, but context matters | Moderate negative relationship between stress and sleep quality |
| ±.50 to ±.69 | Strong | Check for outliers and overlapping constructs | Strong negative relationship between burnout and job satisfaction |
| ±.70 to ±1.00 | Very strong | May indicate overlapping measures or multicollinearity | Very strong relationship between two similar anxiety scales |
Use this table as a guide, not a rigid rule. In nursing research, a weak correlation may still matter if the outcome involves patient safety, medication adherence, falls, infection prevention, readmission risk, or quality of care.
P-Values in Correlation Analysis
A p-value in correlation analysis tests whether the observed relationship is statistically significant under the null hypothesis. In many nursing dissertations, p < .05 is treated as statistically significant.
However, a p-value does not measure the strength of the relationship because it does not prove causation. It does not prove clinical importance. It does not show the probability that the null hypothesis is true. The American Statistical Association warns that scientific conclusions should not be based only on whether a p-value crosses a threshold (Wasserstein & Lazar, 2016).
Nursing Mini-Example: Weak but Significant
A study of 600 nursing students finds:
r = −.14, p = .001
The relationship between stress and sleep quality is statistically significant, but the coefficient is weak. The student should not write that stress has a strong relationship with sleep quality.
A better interpretation is:
There was a statistically significant but weak negative relationship between stress and sleep quality.
Nursing Mini-Example: Moderate but Not Significant
A pilot study of 24 patients finds:
r = −.38, p = .067
The relationship is not statistically significant at the .05 level, but the coefficient suggests a moderate negative pattern. The student should not simply write “there was no relationship.”
A stronger interpretation is:
The correlation was not statistically significant, although the coefficient suggested a moderate negative association. The small sample size may have limited the ability to detect statistical significance.
This type of interpretation is more careful and academically defensible.
Statistical Significance vs Clinical Significance
Nursing research should not stop at statistical significance. A statistically significant relationship may not be clinically important, and a clinically meaningful pattern may fail to reach statistical significance in a small sample.
Statistical significance answers this question:
Is the observed relationship unlikely under the null hypothesis?
Clinical significance answers a different question:
Does the relationship matter for patient care, nursing education, safety, quality improvement, or health outcomes?
For example, a weak correlation between nurse workload and medication errors may still matter if the outcome involves patient harm. A moderate correlation between stress and sleep quality among nursing students may support wellness programming, even if the design does not prove causation.
A strong Chapter 4 and Chapter 5 interpretation should discuss:
Sample size.
Effect size.
Measurement quality.
Clinical context.
Practical implications.
Study limitations.
Risk of overstatement.
A student should interpret both the coefficient and the p-value. A small statistically significant association should not be exaggerated. A non-significant moderate association in a small sample should be interpreted cautiously rather than ignored.
Correlation Matrix in Nursing Research
A correlation matrix is a table that displays correlations among several variables. Instead of showing one relationship, it shows many variable pairs in one organized table.
A nursing student may create a correlation matrix for:
Stress.
Sleep quality.
Burnout.
Job satisfaction.
Depression score.
Social support.
Health literacy.
Self-care behavior.
A correlation matrix is useful in Chapter 4 when the student has several relationship-based research questions. It is also useful before regression because very high correlations among predictors may suggest multicollinearity. In scale validation or preliminary analysis, a correlation matrix may help show how subscales or constructs relate.
However, students should avoid running many correlations without a clear purpose. The more correlations a student runs, the greater the risk of chance findings. The matrix should be tied to research questions, hypotheses, or a justified exploratory purpose.
APA Style provides sample correlation-table guidance and emphasizes clear table construction (American Psychological Association, n.d.-a).
Table 7. Sample Correlation Matrix for Nursing Variables
| Variable | 1 | 2 | 3 | 4 |
|---|---|---|---|---|
| 1. Stress score | — | |||
| 2. Sleep quality score | −.42** | — | ||
| 3. Burnout score | .51** | −.38** | — | |
| 4. Job satisfaction score | −.35* | .22 | −.57** | — |
Note. Values are examples only. p < .05. p < .01. Replace values with actual dissertation results.
How Correlation Analysis Fits Chapter 3, Chapter 4, and Chapter 5
Correlation analysis should not appear only in the results section. It should connect logically across the dissertation.
Chapter 3: Methodology
In Chapter 3, the student should justify why correlation analysis is the correct test. This includes explaining the research question, identifying the variables, describing measurement levels, naming the selected correlation coefficient, and explaining how assumptions will be checked.
A strong Chapter 3 statement may look like this:
Pearson correlation will be used to examine the relationship between medication adherence scores and systolic blood pressure because both variables are continuous and the research question asks whether the variables are associated. Assumptions will be evaluated using descriptive statistics, scatterplots, normality review, and outlier screening.
If assumptions are not met, the student should explain the alternative plan:
If the variables are skewed, ordinal, or affected by outliers, Spearman rank-order correlation will be considered as a nonparametric alternative.
Chapter 4: Results
In Chapter 4, the student should report the actual results. This includes the sample size, correlation coefficient, p-value, direction, strength, and interpretation.
A strong Chapter 4 results paragraph should not include a long textbook explanation. It should state the analysis and interpret the finding clearly.
Chapter 5: Discussion
In Chapter 5, the student should explain what the result means in relation to prior literature, nursing practice, theory, limitations, and future research. This is also where the student should be especially careful not to overstate causation.
For example:
The finding suggests that higher medication adherence was associated with lower systolic blood pressure in this sample. However, because the study used a correlational design, the result does not establish that adherence caused blood pressure reduction.
This Chapter 3/4/5 alignment makes the dissertation more coherent and defensible.
How to Run Correlation Analysis in SPSS
SPSS is commonly used for nursing dissertation statistics. This section gives a brief overview, not a full screenshot tutorial.
A typical SPSS workflow includes:
Prepare and clean the dataset.
Confirm that each variable is coded correctly.
Check missing data.
Compute questionnaire total scores or subscale scores.
Review descriptive statistics.
Inspect histograms, boxplots, and scatterplots.
Go to Analyze > Correlate > Bivariate.
Select Pearson, Spearman, or Kendall based on the data.
Choose two-tailed significance unless a one-tailed test was justified before analysis.
Review the correlation coefficient.
Review the Sig. value.
Make a review of the sample size, usually shown as N.
IBM’s official Bivariate Correlations documentation states that the procedure computes Pearson’s correlation coefficient, Spearman’s rho, and Kendall’s tau-b with significance levels, and that the output can include correlation coefficients, significance levels, and nonmissing cases (IBM, n.d.-a).
What Nursing Students Should Look for in SPSS Output
When reading SPSS output, focus on:
The correlation coefficient: This shows relationship strength and direction.
Sig. (2-tailed): This is the p-value.
N: This is the number of valid paired cases included in the correlation.
Variable labels: These confirm that the correct variables were analyzed.
Missing data pattern: SPSS may use fewer cases than expected if participants have missing values.
For example, if SPSS shows:
Pearson Correlation = −.42
Sig. (2-tailed) = .001
N = 60
The student can interpret this as a statistically significant negative correlation based on 60 valid paired observations.
How to Do Correlation Analysis in Excel
Excel can be useful for simple correlation analysis, quick data checks, scatterplots, and preliminary correlation matrices.
Students can use the CORREL function to calculate the correlation coefficient between two cell ranges. Microsoft explains that the CORREL function returns the correlation coefficient of two cell ranges and can be used to examine relationships between two properties (Microsoft, n.d.-a).
Excel can also produce a correlation matrix using the Data Analysis ToolPak. Microsoft explains that the ToolPak includes data-analysis functions and supports complex statistical data analysis in Excel (Microsoft, n.d.-b).
Excel can help with:
- Simple Pearson correlation.
- Correlation matrices.
- Scatterplots.
- Preliminary data review.
- Basic descriptive checks.
However, Excel has limitations for dissertation-level statistical work. It is weaker for assumption checking, nonparametric correlation reporting, missing-data diagnostics, reproducibility, APA table preparation, and advanced statistical workflows.
For many nursing dissertations, SPSS, Jamovi, JASP, R, or professional statistical support may be more defensible, especially when the student needs assumption checks, Spearman correlation, APA reporting, or Chapter 4 interpretation.
Students using Excel may also review Using Excel for Data Analysis.
How to Report Correlation Analysis in APA 7th Edition
APA reporting is one of the most important parts of a nursing dissertation results chapter. Many students run the correct test but report the result incompletely.
A complete APA-style correlation report should include:
- The test used.
- The variables examined.
- The correlation coefficient.
- The direction of the relationship.
- The strength of the relationship.
- The p-value.
- The sample size or degrees of freedom where appropriate.
- A noncausal interpretation.
- A clear connection to the research question.
APA Style states that letters used as statistical symbols should be italicized, including symbols such as p, r, and R² (American Psychological Association, 2024).
APA Reporting Rules for Correlation
Use italic statistical symbols:
r, p, N, M, SD
Report exact p-values when possible:
p = .032
Use p < .001 when the value is very small.
Avoid writing p = .000.
Use consistent decimal places according to institutional preference.
Do not report only the p-value.
Do not claim causation.
Weak APA Reporting
The correlation was significant.
This is weak because it does not tell the reader which variables were examined, which test was used, how strong the relationship was, what direction it had, or how it should be interpreted.
Strong APA Reporting
A Pearson correlation was conducted to examine the relationship between medication adherence scores and systolic blood pressure. The results showed a statistically significant negative relationship, r(58) = −.42, p = .001, indicating that higher medication adherence scores were associated with lower systolic blood pressure. Because the analysis was correlational, causality cannot be inferred.
This version is stronger because it includes the test, variables, coefficient, p-value, direction, interpretation, and causation caution.
Example APA Write-Up for Pearson Correlation
A Pearson correlation was conducted to examine the relationship between medication adherence scores and systolic blood pressure among adult patients with hypertension. The results showed a statistically significant negative correlation between medication adherence and systolic blood pressure, r(58) = −.42, p = .001. This finding indicates that higher medication adherence scores were associated with lower systolic blood pressure. The result suggests an association between adherence and blood pressure control, but causality cannot be inferred from the correlation analysis.
Use this structure when:
Both variables are continuous.
Pearson assumptions are reasonably met.
The relationship is approximately linear.
Serious outliers are absent or handled appropriately.
The same participants have data for both variables.
Example APA Write-Up for Spearman Correlation
A Spearman rank-order correlation was conducted to examine the relationship between perceived stress scores and sleep quality ratings among nursing students. The results showed a statistically significant negative association, rs = −.39, p = .004, N = 54. Higher perceived stress scores were associated with poorer sleep quality ratings. Because the analysis was correlational, the finding should be interpreted as an association rather than evidence that stress caused poor sleep.
Use this structure when:
The data are ordinal.
The data are ranked.
The variables are skewed.
The relationship is monotonic.
Pearson assumptions are not met.
Example APA Write-Up for a Non-Significant Pearson Correlation
A Pearson correlation was conducted to examine the relationship between age and patient satisfaction scores. The results showed a weak, non-significant positive relationship, r(46) = .16, p = .274. This finding indicates that age was not significantly associated with patient satisfaction in the sample.
This wording is better than saying “there was no relationship.” A non-significant result means the relationship was not statistically significant in the sample. It does not prove that no relationship exists in every population or setting.
Example APA Write-Up for a Non-Significant Spearman Correlation
A Spearman rank-order correlation was conducted to examine the relationship between pain severity ratings and satisfaction ratings among postoperative patients. The results showed a weak, non-significant negative association, rs = −.18, p = .214, N = 50. This finding indicates that pain severity ratings were not significantly associated with satisfaction ratings in the sample.
This type of write-up reports the coefficient, direction, strength, p-value, and sample size without overstating the result.
Sample Correlation Analysis Table for Chapter 4
Table 8. Sample APA-Style Correlation Results Table
| Variable pair | Test used | Correlation coefficient | p-value | Direction | Interpretation |
|---|---|---|---|---|---|
| Medication adherence and systolic blood pressure | Pearson | r = −.42 | .001 | Negative | Higher adherence was associated with lower systolic blood pressure |
| Stress and sleep quality | Spearman | rs = −.39 | .004 | Negative | Higher stress was associated with poorer sleep quality |
| Burnout and job satisfaction | Pearson | r = −.55 | < .001 | Negative | Higher burnout was associated with lower job satisfaction |
| Patient satisfaction and nurse communication | Spearman | rs = .47 | .002 | Positive | Higher communication ratings were associated with higher satisfaction |
| Age and satisfaction | Pearson | r = .16 | .274 | Positive | Age was not significantly associated with satisfaction |
Note. r = Pearson correlation coefficient; rs = Spearman rank-order correlation coefficient; p = probability value. Values are examples only. Replace them with actual dissertation results.
Common Mistakes Nursing Students Make in Correlation Analysis
Many correlation mistakes happen because students focus only on software output instead of research design, assumptions, and interpretation.
Claiming Causation From Correlation
This is the most serious mistake. Do not write that stress caused poor sleep, adherence caused blood pressure control, or communication caused satisfaction unless the study design supports causal inference.
Using Pearson When Spearman Is More Appropriate
Pearson correlation may be inappropriate for ordinal, skewed, ranked, or non-linear data. Students should justify the selected test.
Failing to Check Assumptions
A student should not simply run SPSS and copy the coefficient. Assumption checks are part of defensible statistical analysis.
Ignoring Scatterplots
A scatterplot may reveal outliers, clusters, or curved relationships that the coefficient alone does not show.
Reporting Only the P-Value
A report such as “the result was significant, p = .02” is incomplete. Always report the coefficient and direction.
Saying “No Relationship” When P > .05
A non-significant result means the relationship was not statistically significant in the sample. It does not prove that no relationship exists.
Over-Interpreting Weak Correlations
A statistically significant weak correlation should still be described as weak.
Confusing Statistical and Clinical Significance
A significant result may not be clinically important. A clinically meaningful pattern may need cautious discussion even when p > .05.
Using Correlation When Another Test Is Needed
Do not use correlation for group comparisons, pretest-posttest change, multiple-predictor prediction, or agreement.
Running Too Many Correlations Without a Plan
Too many correlations can increase the risk of chance findings. Link analyses to research questions or hypotheses.
Correlation Analysis vs Regression Analysis
Both Correlation and regression examine relationships between variables, but they answer different questions.
<p>Correlation examines association. Regression predicts or explains an outcome variable using one or more predictors. StatPearls explains that correlation helps identify strength and direction of association, while regression is used to predict and explain a dependent variable from one or more independent variables (Wisniewski & Brannan, 2024).
Example:
Correlation question: Is burnout related to job satisfaction?
Regression question: Do burnout, workload, years of experience, and shift type predict job satisfaction?
Regression is more appropriate when the student needs to control for covariates such as age, gender, baseline score, clinical unit, years of experience, or education level. However, regression also does not automatically prove causation unless the design and assumptions support causal inference.
Correlation Analysis vs Chi-Square Test
Chi-square is usually used when both variables are categorical. Correlation is usually used when variables are numerical, ordinal, ranked, or specific dichotomous forms.
Examples:
Chi-square: Is smoking status associated with readmission category?
Pearson correlation: Is age related to systolic blood pressure?
Spearman correlation: Is ordinal pain rating related to satisfaction rating?
Phi coefficient: Are two binary variables associated?
For example, if medication adherence is coded as adherent/not adherent and blood pressure control is coded as controlled/not controlled, chi-square may be more appropriate than Pearson correlation.
Correlation Analysis vs T-Test and ANOVA
T-tests and ANOVA compare group means. Correlation examines relationships between variables.
Use a t-test when comparing two groups:
Do intervention and control groups differ in mean anxiety scores?
Use ANOVA when comparing three or more groups:
Do nurses in ICU, emergency, and medical-surgical units differ in mean burnout scores?
Use correlation when examining whether two variables are related:
Are burnout scores related to job satisfaction scores?
This difference is important because using correlation for a group-comparison question may produce output that does not answer the research question.
How to Know Whether Correlation Is the Right Test for Your Nursing Dissertation
Use this checklist before choosing correlation analysis.
Does my research question ask about a relationship or association?
Are both variables measured on the same participants?
What is the measurement level of each variable?
Is this a groups comparison instead?
Am I testing change over time?
Am I trying to predict an outcome using several predictors?
Are my variables continuous, ordinal, dichotomous, or categorical?
Have I checked scatterplots and assumptions?
Can I explain the result without claiming causation?
Can I report the result in APA 7th edition?
Table 9. Decision Table for Choosing Correlation or Another Test
| Research goal | Example question | Likely test | Why |
|---|---|---|---|
| Examine relationship between two scale variables | Is stress related to sleep quality? | Pearson or Spearman | Relationship-based question |
| Compare two independent groups | Do intervention and control groups differ in anxiety scores? | Independent-samples t-test or Mann–Whitney U | Group comparison |
| Compare three or more groups | Do satisfaction scores differ across three hospital units? | ANOVA or Kruskal–Wallis | More than two groups |
| Compare pretest and posttest scores | Did knowledge improve after education? | Paired t-test or Wilcoxon signed-rank | Same participants measured twice |
| Examine two categorical variables | Is smoking status associated with readmission status? | Chi-square | Categorical association |
| Predict outcome from several variables | Do workload, burnout, and shift type predict job satisfaction? | Regression | Prediction with multiple predictors |
Getting Help With Correlation Analysis in Nursing Research
Correlation analysis may look simple, but it affects several parts of a nursing dissertation or capstone project. It affects Chapter 3 methodology, data cleaning, questionnaire scoring, assumption checking, SPSS analysis, Excel analysis, Chapter 4 results, APA tables, and Chapter 5 interpretation.
Students often need help with questions such as:
Should I use Pearson or Spearman correlation?
Is my Likert-scale variable suitable for correlation?
How do I interpret SPSS correlation output?
What does Sig. (2-tailed) mean?
How do I report r, rs, p, and N in APA 7th edition?
Should I use correlation, chi-square, regression, t-test, or ANOVA?
How do I explain a non-significant correlation?
How do I avoid saying correlation proves causation?
Nursing Dissertation Help can support students with:
Correlation analysis.
Pearson and Spearman correlation.
SPSS analysis.
Excel analysis.
Data cleaning.
Questionnaire scoring.
Assumption checking.
Correlation matrix interpretation.
APA 7th results reporting.
Chapter 4 writing.
Dissertation statistics consultation.
If you already have a dataset, SPSS output, Excel file, survey results, or Chapter 4 draft, expert help can make your results clearer, more accurate, and easier to defend.
Frequently Asked Questions About Correlation Analysis in Nursing Research
What is correlation analysis in nursing research?
Correlation analysis in nursing research is a statistical method used to examine whether two variables are related. It helps students understand the direction and strength of relationships, such as stress and sleep quality, burnout and job satisfaction, or medication adherence and blood pressure.
When should I use Pearson correlation?
Use Pearson correlation when both variables are continuous, the relationship is approximately linear, paired data are available, and serious outliers are absent. Pearson is common for scale scores, clinical measurements, and questionnaire total scores when assumptions are met.
When should I use Spearman correlation?
Use Spearman correlation when variables are ordinal, ranked, skewed, non-normal, or better understood as monotonic rather than linear. Spearman is often useful for Likert-type ratings, symptom rankings, satisfaction ratings, and non-normal nursing scale scores.
How do I interpret a correlation coefficient?
Interpret the correlation coefficient by looking at its sign, size, and p-value. The sign shows direction. The size shows strength. The p-value shows statistical significance. A negative correlation can still be strong if its absolute value is large.
Does correlation prove causation?
No. Correlation does not prove causation. A significant correlation shows that two variables are associated in the sample, but it does not prove that one variable caused the other.
What does a p-value mean in correlation analysis?
A p-value shows whether the observed relationship is statistically significant under the null hypothesis. It does not measure the strength of the relationship, prove causation, or prove clinical importance.
What is a correlation matrix?
A correlation matrix is a table showing correlations among several variables. It is useful when a student needs to report multiple relationships or examine associations before regression analysis.
Can I run correlation analysis in Excel?
Yes. Excel can calculate simple correlation coefficients using the CORREL function or the Data Analysis ToolPak. However, SPSS, Jamovi, JASP, R, or professional statistical support may be better for assumption checks, nonparametric tests, and APA dissertation reporting.
How do I report correlation in APA 7th edition?
Report the test used, variables, correlation coefficient, p-value, sample size or degrees of freedom, direction, strength, and interpretation. Use noncausal language. For example: A Pearson correlation showed a statistically significant negative relationship between medication adherence and systolic blood pressure, r(58) = −.42, p = .001.
What if my correlation is not statistically significant?
Report the result honestly. Do not write “there was no relationship” without qualification. Instead, state that the relationship was not statistically significant in the sample and include the coefficient, direction, and p-value.
Conclusion
Correlation analysis in nursing research is useful when students need to examine relationships among healthcare, clinical, behavioral, psychosocial, educational, and nursing workforce variables. It can help answer questions about stress and sleep, adherence and blood pressure, burnout and job satisfaction, patient satisfaction and nurse communication, health literacy and self-care, pain and quality of life, and many other nursing research topics.
However, correlation analysis must be selected, interpreted, and reported carefully. Students must choose the correct test, check assumptions, inspect scatterplots, interpret the coefficient and p-value together, consider clinical significance, avoid causal claims, and report results in APA 7th edition.
Most importantly, correlation does not prove causation. A significant relationship means the variables were associated in the data, not that one variable caused the other.
If you are unsure whether to use Pearson, Spearman, chi-square, regression, t-test, or ANOVA, or if you need help interpreting SPSS output, preparing APA 7th tables, writing Chapter 4 results, or explaining correlation findings without causal errors, request expert support from Nursing Dissertation Help.
References
Akoglu, H. (2018). User’s guide to correlation coefficients. Turkish Journal of Emergency Medicine, 18(3), 91–93. https://doi.org/10.1016/j.tjem.2018.08.001
American Psychological Association. (n.d.-a). Sample tables. APA Style.
American Psychological Association. (n.d.-b). Table setup. APA Style.
American Psychological Association. (2024). Number and statistics guide. APA Style.
BMJ. (n.d.). Correlation and regression. Statistics at Square One.
Brydges, C. R. (2019). Effect size guidelines, sample size calculations, and statistical power in gerontology. Innovation in Aging, 3(4), igz036. https://doi.org/10.1093/geroni/igz036
IBM. (n.d.-a). Bivariate correlations. IBM SPSS Statistics Documentation.
IBM. (n.d.-b). Nonlinear canonical correlation analysis. IBM SPSS Statistics Documentation.
Microsoft. (n.d.-a). CORREL function. Microsoft Support.
Microsoft. (n.d.-b). Use the Analysis ToolPak to perform complex data analysis. Microsoft Support.
Mukaka, M. M. (2012). Statistics corner: A guide to appropriate use of correlation coefficient in medical research. Malawi Medical Journal, 24(3), 69–71.
Schober, P., Boer, C., & Schwarte, L. A. (2018). Correlation coefficients: Appropriate use and interpretation. Anesthesia & Analgesia, 126(5), 1763–1768. https://doi.org/10.1213/ANE.0000000000002864
STROBE. (n.d.). Strengthening the Reporting of Observational Studies in Epidemiology.
Wasserstein, R. L., & Lazar, N. A. (2016). The ASA statement on p-values: Context, process, and purpose. The American Statistician, 70(2), 129–133. https://doi.org/10.1080/00031305.2016.1154108
Wisniewski, S. J., & Brannan, G. D. (2024). Correlation coefficient, partial, and Spearman rank, and regression analysis. In StatPearls. StatPearls Publishing.
