

Introduction
Many nursing students reach the results chapter with a dataset that has a yes/no outcome but no clear plan for analysis. The outcome may be readmitted/not readmitted, adherent/non-adherent, controlled/uncontrolled blood pressure, infection present/absent, improved/not improved, or passed/failed. The problem is not only choosing the correct statistical test. Students also need to code the dependent variable correctly, choose justified predictors, check assumptions, understand SPSS logistic regression output, interpret Exp(B), and report odds ratios in APA 7th edition format.
SPSS logistic regression helps nursing and healthcare students examine whether one or more predictors are associated with the odds of a binary outcome. IBM describes binary logistic regression as useful when the goal is to model the event probability for a categorical response variable with two outcomes (IBM, n.d.-a).
Need help running logistic regression in SPSS? Our SPSS Data Analysis Help service can help you code your outcome variable, check predictors, run the model, interpret odds ratios, and prepare APA-style results for your nursing research.
What Is Logistic Regression in SPSS?
Logistic regression in SPSS is a regression procedure used when the dependent variable is categorical. This article focuses on binary logistic regression, which is used when the dependent variable has two categories.
Common nursing and healthcare examples include:
- Readmitted vs not readmitted
- Controlled vs uncontrolled blood pressure
- Medication adherent vs non-adherent
- Infection present vs absent
- Improved vs not improved
- Passed vs failed a competency assessment
- High-risk vs low-risk screening classification
Binary logistic regression estimates the odds that a case belongs to the event category. Predictors may be continuous, categorical, or a combination of both. For example, a model may examine whether age, BMI, knowledge score, discharge education, and comorbidity status predict 30-day readmission.
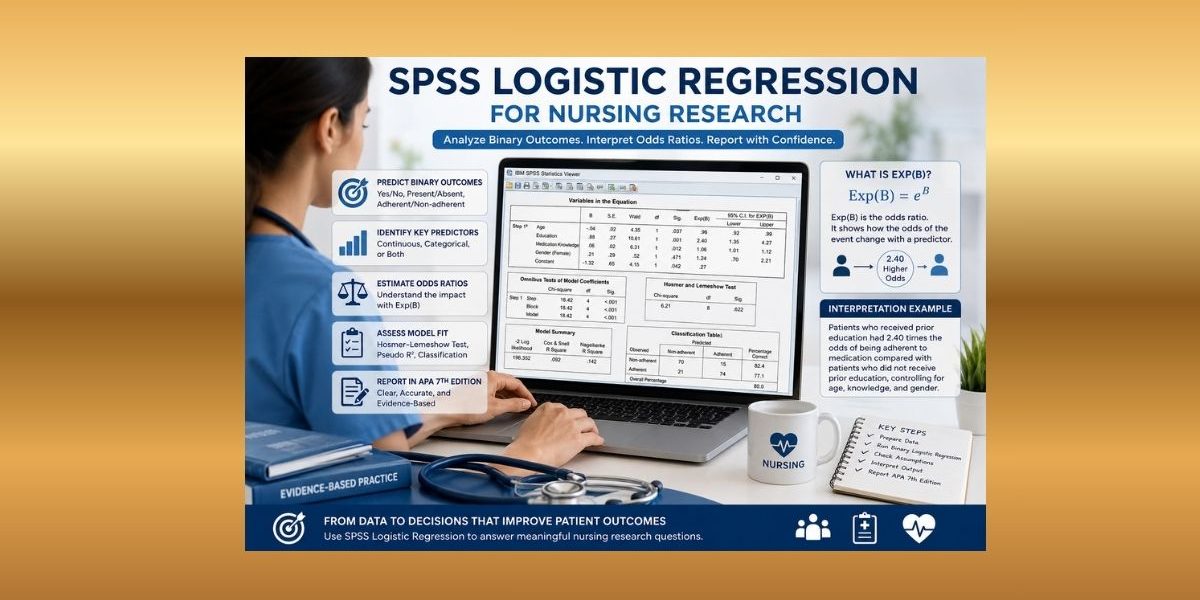
SPSS reports the regression coefficient, standard error, Wald test, p-value, Exp(B), and confidence interval for Exp(B). Exp(B) is the odds ratio and is usually the most important value for nursing interpretation.
When Should Nursing Students Use SPSS Logistic Regression?
Use SPSS logistic regression when the dependent variable has two categories and the research question asks whether predictors are associated with the odds of an outcome.
It is appropriate when:
- The outcome variable is binary.
- The study examines predictors of group membership or outcome status.
- Predictors are categorical, continuous, or both.
- The research question focuses on prediction, association, or adjusted effects.
- The analysis needs to control for several predictors in one model.
For example, a DNP student may test whether discharge education predicts readmission status while controlling for age and comorbidity. A PhD nursing student may examine whether medication knowledge and self-efficacy predict adherence status. A quality improvement student may examine whether a training intervention predicts competency pass status.
Do not use binary logistic regression for a continuous outcome such as systolic blood pressure, pain score, anxiety score, or length of stay. Use linear regression or another appropriate method. If the outcome has three or more unordered categories, consider multinomial logistic regression. If the categories are ordered, consider ordinal logistic regression.
Logistic regression is part of quantitative hypothesis testing, so students often use it alongside broader Inferential Data Analysis in Nursing Research.
Logistic Regression vs Linear Regression
Linear regression predicts a continuous outcome. Logistic regression predicts the probability or odds of a categorical outcome.
For example, if the dependent variable is systolic blood pressure measured in mmHg, linear regression may be appropriate. If the dependent variable is blood pressure control coded as controlled/uncontrolled, binary logistic regression is more appropriate.
The interpretation also differs. Linear regression coefficients describe expected changes in a continuous outcome. Logistic regression coefficients are in log-odds units, so students usually interpret Exp(B), the odds ratio. IBM notes that logistic regression is suited to dichotomous dependent variables and that coefficients can be used to estimate odds ratios for predictors in the model (IBM, n.d.-b).
Nursing Research Questions for Logistic Regression
Good logistic regression questions clearly identify the binary outcome and the predictors.
Examples include:
- Does age, BMI, and medication adherence predict uncontrolled blood pressure?
- Outcome: controlled vs uncontrolled blood pressure
- Predictors: age, BMI, adherence status
- Do education level and prior clinical training predict whether nurses pass a competency assessment?
- Outcome: pass vs fail
- Predictors: education level, prior training
- Does discharge education predict 30-day readmission status?
- Outcome: readmitted vs not readmitted
- Predictor: discharge education
- Do pain score, procedure type, and age predict whether a patient requires rescue analgesia?
- Outcome: rescue analgesia required vs not required
- Predictors: pain score, procedure type, age
- Do medication knowledge and self-efficacy predict adherence status?
- Outcome: adherent vs non-adherent
- Predictors: knowledge score, self-efficacy score
The outcome must remain binary. If the student changes adherence into low, moderate, and high adherence, binary logistic regression is no longer the correct method unless the categories are collapsed into two justified groups.
Before Running Logistic Regression in SPSS
Before running binary logistic regression in SPSS, prepare the dataset carefully.
First, code the dependent variable with two clear categories. For example, medication adherence may be coded as 0 = non-adherent and 1 = adherent. The event category should match the research question. If the student wants to predict adherence, then adherence should be the modeled event. If the coding is reversed, the odds ratios may answer the opposite question.
Second, label categorical predictors clearly. Gender, intervention group, education level, clinic type, insurance status, or discharge education status should have meaningful value labels. Reference categories matter because categorical predictors are interpreted relative to the reference group.
Third, check missing values. Missing-value codes such as 99, 999, or -9 should not be treated as real data. Review frequencies, means, standard deviations, minimums, maximums, and missing-value patterns before modeling. This step connects with Descriptive Data Analysis in Nursing Research because descriptive checks help identify coding errors before inferential testing.
Finally, choose predictors based on the research question, literature, theory, and study plan. Do not include every available variable simply because it exists in the dataset.
Assumptions and Conditions for Logistic Regression
Binary Dependent Variable
The dependent variable must have two categories. Examples include yes/no, present/absent, controlled/uncontrolled, and adherent/non-adherent.
Independent Observations
Each participant should usually contribute one independent record. If patients are clustered within clinics, hospitals, wards, or schools, ordinary logistic regression may underestimate standard errors. Clustered or repeated data may require another model.
Correct Event Coding
Students must confirm which category SPSS is modeling. The dependent variable encoding table should be checked before interpreting Exp(B). If SPSS models the opposite event, the odds ratios may still be statistically correct but practically misleading.
Appropriate Predictor Coding
Categorical predictors must be coded and referenced correctly. A poorly chosen reference category can make results confusing. For example, “no patient education” may be a clearer reference category than “received patient education” when the study tests whether education improves adherence.
Linearity of Continuous Predictors With the Logit
Continuous predictors should have a reasonably linear relationship with the log odds of the outcome. This is different from requiring the predictor itself to be normally distributed. A practical check is to examine whether the continuous predictor behaves reasonably across grouped values or to use a logit-linearity approach such as testing an interaction between the predictor and its log transformation when appropriate. If the relationship is clearly non-linear, transformation, categorization, or another modeling strategy may be needed.
No Severe Multicollinearity
Predictors should not be highly redundant. For example, knowledge score, education score, and health literacy score may overlap strongly. Severe multicollinearity can create unstable coefficients, wide confidence intervals, and confusing predictor results.
Adequate Sample Size and Events
Logistic regression needs enough cases and enough outcome events. Avoid treating one fixed “events per variable” rule as universal. Riley et al. (2019) explain that sample-size planning for binary models should consider outcome proportion, number of predictor parameters, overfitting, and expected model performance rather than relying only on a simple rule of thumb (Riley et al., 2019).
No Extreme Influential Cases
Unusual cases can affect model estimates. Casewise diagnostics, residuals, and predicted probabilities can help identify records that require review.
How to Run Binary Logistic Regression in SPSS
Use these steps:
- Open the dataset in SPSS.
- Click Analyze.
- Select Regression.
- Click Binary Logistic.
- Move the binary outcome variable into the Dependent box.
- Move predictor variables into the Covariates box.
- Click Categorical if categorical predictors are included.
- Move categorical predictors into the categorical covariates box.
- Choose the contrast and reference category if needed.
- Click Continue.
- Click Options.
- Request confidence intervals for Exp(B).
- Request the Hosmer-Lemeshow goodness-of-fit test if required.
- Request casewise diagnostics if influential or unusual cases are a concern.
- Click Continue.
- Choose Enter unless the study plan justifies another method.
- Click OK.
IBM’s SPSS logistic regression options allow users to request classification plots, Hosmer-Lemeshow goodness-of-fit, casewise residual listings, correlations of estimates, iteration history, and confidence intervals for Exp(B) (IBM, n.d.-c).
Do not choose stepwise methods simply because SPSS offers them. Predictor selection should be based on the research question, theoretical framework, prior literature, and analysis plan.
SPSS Logistic Regression Output: What to Read
Start with the Case Processing Summary. It shows the number of included and excluded cases. If many cases are excluded, review missing data before trusting the model.
Next, check Dependent Variable Encoding. This table confirms how SPSS coded the outcome. It is one of the most important tables because odds ratios depend on the modeled event.
Review Categorical Variables Codings when categorical predictors are included. This table shows the reference category and coding scheme.
The Omnibus Tests of Model Coefficients table shows whether the predictor model improves fit compared with the baseline model.
The Model Summary includes -2 Log Likelihood and pseudo R-square values such as Cox & Snell and Nagelkerke. These values help describe model fit, but they are not interpreted like R-square in linear regression.
The Hosmer-Lemeshow Test provides a goodness-of-fit check when requested. It should be interpreted with caution and alongside the rest of the model.
The Classification Table shows classification accuracy, sensitivity, and specificity patterns, but it can be misleading when one outcome category is much larger than the other.
The Variables in the Equation table contains B, standard error, Wald test, p-value, Exp(B), and confidence intervals. UCLA OARC explains that Exp(B) is the exponentiated coefficient and is interpreted as an odds ratio (UCLA OARC, n.d.).
How to Interpret Exp(B) and Odds Ratios in SPSS
Exp(B) is the odds ratio in SPSS logistic regression.
Assuming that Exp(B) is greater than 1, the predictor is associated with higher odds of the event. If Exp(B) is less than 1, the predictor is associated with lower odds of the event. If Exp(B) equals 1, the odds do not change.
Example:
Assuming that Exp(B) = 2.40 for prior education, participants who received prior education have 2.40 times the odds of medication adherence compared with participants who did not receive prior education, holding other variables constant.
If Exp(B) = 0.70 for age measured in years, each one-year increase in age is associated with lower odds of the event, holding other variables constant. If a one-year unit is too small to be meaningful, the student may rescale age into 5-year or 10-year units before analysis.
Odds are not the same as probability. An odds ratio of 2.40 does not mean the probability is 2.40 times higher. It means the odds are 2.40 times higher.
Interpret odds ratios with the confidence interval and clinical context. A statistically significant odds ratio may still have limited practical value if the effect is small or the interval is wide.
How to Interpret Model Fit in SPSS Logistic Regression
Model fit should be interpreted using several pieces of output, not one statistic.
The Omnibus Tests of Model Coefficients show whether the model with predictors fits better than the intercept-only model. A significant result suggests that the predictors improve the model.
Pseudo R-square values describe approximate model improvement, but they do not mean the same thing as R-square in linear regression. Do not write that “Nagelkerke R-square explains 40% of variance” as if it were ordinary linear regression R-square.
The Hosmer-Lemeshow test is commonly used as a goodness-of-fit check, but it should not be treated as the only measure of model adequacy. Hosmer et al. (2013) emphasize model assessment as a broader process involving fit, diagnostics, and meaningful interpretation (Hosmer et al., 2013).
Classification accuracy also needs caution. If 90% of patients were not readmitted, a model could appear accurate by predicting nearly everyone as not readmitted. Always interpret classification results alongside group balance, odds ratios, confidence intervals, and clinical usefulness.
How to Interpret Predictors in the Variables in the Equation Table
The Variables in the Equation table is usually the main table for interpretation.
B is the log-odds coefficient. It shows direction, but most nursing students report the odds ratio instead because odds ratios are easier to interpret.
The Wald test and p-value indicate whether the predictor is statistically significant in the model.
Exp(B) is the odds ratio. It tells how the odds of the event change for a one-unit increase in a continuous predictor or relative to a reference category for a categorical predictor.
The 95% CI for Exp(B) shows precision. A wide interval suggests uncertainty. If the interval includes 1.00, the predictor is usually not statistically significant at the .05 level.
For a categorical predictor, always name the reference group. For example, “Patients who received discharge education had higher odds of medication adherence than patients who did not receive discharge education.”
And for a continuous predictor, state the unit. For example, “Each one-point increase in medication knowledge score was associated with higher odds of adherence.”
Common Mistakes in SPSS Logistic Regression
Common mistakes include:
- Using logistic regression for a continuous outcome
- Coding the outcome variable incorrectly
- Failing to check which event SPSS modeled
- Forgetting reference categories
- Treating odds ratios as probabilities
- Reporting p-values without odds ratios
- Ignoring confidence intervals
- Overinterpreting pseudo R-square values
- Overinterpreting the classification table
- Using stepwise methods without justification
- Including too many predictors for the number of events
- Ignoring missing data
- Reporting SPSS output without linking results to the research question
If your SPSS logistic regression output has confusing Exp(B) values, reference categories, model-fit tables, or odds ratios, our Dissertation Data Analysis Help service can help you interpret the results and write them clearly.
How to Report Logistic Regression in APA 7th Edition
A strong APA-style logistic regression report should include the purpose of the model, binary outcome, predictors, coding or reference categories, sample size, model-fit results, odds ratios, confidence intervals, p-values, and interpretation.
Use exact p-values when possible, but do not report p = .000. APA Style guidance recommends reporting exact p-values in tables and figures unless p is less than .001, in which case it should be reported as p < .001 (American Psychological Association, 2024).
Example:
A binary logistic regression was conducted to examine whether age, medication knowledge, and prior patient education predicted medication adherence status. The overall model was statistically significant, χ²(3) = 18.42, p < .001. Prior patient education was associated with higher odds of medication adherence, OR = 2.40, 95% CI [1.35, 4.27], p = .003, controlling for age and medication knowledge.
Students must replace all placeholder values with exact SPSS output. For help explaining predictor effects, p-values, confidence intervals, and adjusted results, review Inferential Statistics Help for Nursing Research.
SPSS Logistic Regression Example for Nursing Research
A nursing student examines whether age, gender, medication knowledge, and prior patient education predict medication adherence status among 180 adults with hypertension.
Binary logistic regression is appropriate because the dependent variable has two categories: 0 = non-adherent and 1 = adherent. Age and medication knowledge are continuous predictors. Gender and prior patient education are categorical predictors.
Before running the model, the student checks adherence frequencies, missing values, gender coding, education coding, and descriptive statistics for age and medication knowledge. The student confirms that adherence is the modeled event because the research question focuses on predictors of adherence.
In SPSS, adherence status is placed in the Dependent box. Age, gender, medication knowledge, and prior patient education are entered as predictors. Gender and patient education are entered as categorical covariates, with meaningful reference categories.
After running the model, the student reviews the dependent variable encoding, categorical variables coding, Omnibus Tests, model summary, Hosmer-Lemeshow test, classification table, and Variables in the Equation table.
If prior patient education has OR = 2.40, 95% CI [1.35, 4.27], p = .003, the student can report that patients who received prior education had significantly higher odds of medication adherence than those who did not, controlling for age, gender, and medication knowledge. The nursing implication is that structured patient education may be associated with improved adherence status.
When Logistic Regression May Not Be Enough
Binary logistic regression may not be enough when the outcome has more than two unordered categories, such as home, rehabilitation facility, and long-term care. Multinomial logistic regression may be needed.
Suppose the outcome categories are ordered, such as low, moderate, and high risk, ordinal logistic regression may be more appropriate.
If patients are clustered within clinics, wards, hospitals, or schools, a multilevel model or generalized estimating equation may be needed. Incase the same participants are measured repeatedly, repeated-measures methods may be required. If the outcome is time until readmission, relapse, infection, or death, Cox regression may be more appropriate.
And if the sample size is too small or the number of outcome events is limited, the model may be unstable. In that case, the student may need to reduce predictors, revise the analysis plan, or seek statistical guidance.
When to Get Help With SPSS Logistic Regression
Students often need help when they are unsure whether logistic regression is appropriate, when the outcome variable is coded incorrectly, or when the modeled event is unclear.
Support may also be useful when the model includes both categorical and continuous predictors, reference categories are confusing, Exp(B) values seem difficult to explain, or confidence intervals are wide.
Many students also seek help after a supervisor requests revised regression tables, clearer odds ratio interpretation, stronger APA reporting, or a better explanation of model fit. SPSS Data Analysis Help can support SPSS setup and output interpretation, while Dissertation Data Analysis Help can support broader results chapter writing and revision.
Conclusion
SPSS logistic regression helps nursing and healthcare students examine predictors of binary outcomes such as adherence, readmission, infection status, improvement, competency results, blood pressure control, and risk classification. It is appropriate when the dependent variable has two categories and the research question focuses on the odds of an event.
Accurate interpretation requires more than running the Binary Logistic Regression menu. Students must code the outcome correctly, confirm the modeled event, choose justified predictors, handle reference categories, check missing data, assess assumptions, evaluate model fit, interpret odds ratios, review confidence intervals, and report results in APA 7th edition format.
Need your logistic regression results checked before submission? Upload your dataset, SPSS output, research questions, hypotheses, and rubric through our SPSS Data Analysis Help page for support with odds ratios, model fit, predictor interpretation, and APA-style reporting.
FAQs
What is SPSS logistic regression?
SPSS logistic regression is a regression procedure used when the dependent variable is categorical. Binary logistic regression is used when the outcome has two categories, such as adherent/non-adherent or readmitted/not readmitted.
When should I use binary logistic regression in SPSS?
Use binary logistic regression in SPSS when your outcome variable has two categories and your research question asks whether one or more predictors are associated with the odds of that outcome.
What does Exp(B) mean in SPSS logistic regression?
Exp(B) is the odds ratio. It shows how the odds of the event change as the predictor increases or as one category is compared with a reference category.
How do I interpret odds ratios in SPSS?
An odds ratio greater than 1 means higher odds of the event. An odds ratio less than 1 means lower odds of the event and an odds ratio of 1 suggests no change in odds.
How do I report logistic regression in APA 7th edition format?
Report the purpose of the model, outcome variable, predictors, sample size, model-fit results, odds ratios, 95% confidence intervals, p-values, and interpretation linked to the research question.
References
American Psychological Association. (2024). Numbers and statistics guide: APA Style 7th edition. https://apastyle.apa.org/instructional-aids/numbers-statistics-guide.pdf
Hosmer, D. W., Jr., Lemeshow, S., & Sturdivant, R. X. (2013). Applied logistic regression (3rd ed.). Wiley. https://doi.org/10.1002/9781118548387
IBM. (n.d.-b). Logistic regression. IBM Documentation. https://www.ibm.com/docs/en/spss-statistics/32.0.0?topic=regression-logistic
IBM. (n.d.-c). Logistic regression options. IBM Documentation. https://www.ibm.com/docs/en/spss-statistics/30.0.0?topic=regression-logistic-options
Riley, R. D., Snell, K. I. E., Ensor, J., Burke, D. L., Harrell, F. E., Jr., Moons, K. G. M., & Collins, G. S. (2019). Minimum sample size for developing a multivariable prediction model: Part II—Binary and time-to-event outcomes. Statistics in Medicine, 38(7), 1276–1296. https://doi.org/10.1002/sim.7992
UCLA Office of Advanced Research Computing. (n.d.). Logistic regression | SPSS annotated output. UCLA OARC Stats. Retrieved June 18, 2026, from https://stats.oarc.ucla.edu/spss/output/logistic-regression/
