

Introduction
Many nursing and healthcare students reach the same problem after entering questionnaire data in SPSS: the dataset looks ready, but the scale has not been checked. The items may use a Likert format, the responses may be coded, and the sample may look complete, yet the student still needs to know whether the items work together before creating a total score or subscale score.
That is where SPSS reliability analysis becomes important. It helps you examine whether related questionnaire items are consistent enough to be used as a scale. This matters before reporting patient satisfaction scores, medication adherence scores, nursing confidence scores, burnout scores, or health education scores in a dissertation.
The challenge is not only running Cronbach’s alpha in SPSS. Students also need to know which output tables matter, how to interpret item-total statistics, what to do with “Cronbach’s alpha if item deleted,” and how to report the result in APA format.
Need help with Cronbach’s alpha? Our SPSS Data Analysis Help service can run the analysis, interpret your SPSS output, and prepare APA-style reliability results.
What Is SPSS Reliability Analysis?
SPSS reliability analysis is a procedure used to check whether several related questionnaire items can work together as one scale or subscale. It is most common when students use Likert-scale items, such as responses ranging from “strongly disagree” to “strongly agree.”
In nursing research, a scale usually measures one construct. For example, a medication adherence scale may include several items about missed doses, following prescription instructions, and taking medication on time. If those items behave consistently, the student may be able to combine them into one adherence score.
Reliability analysis is useful before creating total or average scores. If the items do not work well together, combining them may create a weak or misleading score.
Reliability is not the same as validity. Reliability checks whether the items are consistent. Validity asks whether the scale measures the correct concept.
When Should Nursing Students Use Reliability Analysis in SPSS?
Use reliability analysis in SPSS when your questionnaire has multiple items designed to measure the same construct. It is appropriate for patient satisfaction scales, medication adherence scales, nursing self-confidence scales, knowledge questionnaires, burnout scales, patient education tools, and attitude or perception scales.
It is also useful when your instrument has subscales. For example, a burnout questionnaire may include emotional exhaustion, depersonalization, and personal accomplishment. These should usually be tested separately because they represent different dimensions.
Do not run Cronbach’s alpha on unrelated variables just because they appear in the same dataset. Age, gender, diagnosis, year of study, marital status, and one yes/no question are not scale items.
A simple rule helps: if the items are meant to be added or averaged into one score, reliability analysis is usually relevant. If the variable stands alone, it is not.
What Cronbach’s Alpha Measures in SPSS
Cronbach’s alpha in SPSS estimates how well related items work together as a scale. IBM describes alpha as a reliability model based on the average relationship among items in a scale (IBM Corp., n.d.).
A stronger alpha usually means the items are more consistent with one another. However, alpha does not prove that the questionnaire is valid. A scale can produce a high alpha and still fail to measure the intended nursing or healthcare concept.
A very high alpha also needs caution. Tavakol and Dennick explain that alpha is affected by the number of items, item relationships, and scale structure; very high values may suggest repeated or redundant items rather than a better instrument (Tavakol & Dennick, 2011).
Alpha can also rise when a scale has more items. This means a longer questionnaire may appear stronger statistically even when some items are repetitive. For that reason, Cronbach’s alpha should be interpreted with the questionnaire design, item wording, subscale structure, and study purpose.
Before Running Reliability Analysis in SPSS
Before running an SPSS reliability test, confirm that the items belong to the same construct. Do not combine unrelated questions only because they appear in the same survey section.
Next, check reverse-coded items. If some items are negatively worded, they must be recoded before analysis. For example, if high scores on most items mean high confidence, all items should follow that same direction. A missed reverse-code step can lower alpha and distort item-total statistics.
You should also review missing values, coding errors, minimum values, maximum values, and item distributions. This basic screening step is part of Descriptive Data Analysis in Nursing Research because reliability output can be affected by incomplete data or incorrectly coded responses.
Finally, analyze subscales separately. If your questionnaire has three subscales, run three reliability analyses rather than forcing all items into one alpha.
How to Run Reliability Analysis in SPSS
To run reliability analysis in SPSS:
- Open your dataset in SPSS.
- Click Analyze.
- Select Scale.
- Click Reliability Analysis.
- Move the related scale items into the Items box.
- Choose Model: Alpha.
- Click Statistics.
- Select Item, Scale, and Scale if item deleted.
- Click Continue.
- Click OK.
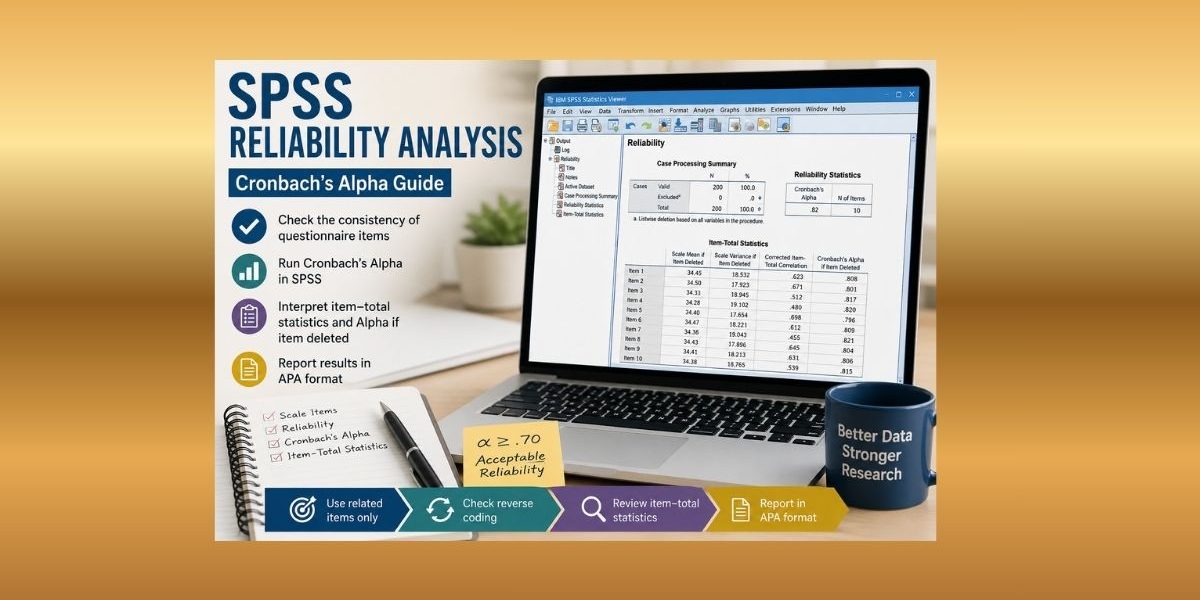
These steps produce the main reliability analysis output in SPSS, including the Case Processing Summary, Reliability Statistics table, and Item-Total Statistics table.
Only move related scale or subscale items into the Items box. Do not include demographic variables, outcome variables, group variables, or single survey questions that are not part of the scale.
SPSS Reliability Analysis Output: What to Read
Case Processing Summary
The Case Processing Summary shows how many cases SPSS included and excluded. If many cases are excluded, missing data may be affecting your result. A reliability result based on fewer cases than expected should be interpreted carefully.
Reliability Statistics
The Reliability Statistics table gives Cronbach’s alpha and the number of items. This is the main result, but it is not the only table to read. For example, Cronbach’s α = .82 for 10 items suggests good scale reliability, but you still need to inspect the items.
Item-Total Statistics
The Item-Total Statistics table shows how each item relates to the full scale. The corrected item-total correlation is especially important. A low value may suggest that the item does not fit well with the other items.
Cronbach’s Alpha if Item Deleted
The “Cronbach’s alpha if item deleted” column shows what alpha would become if a specific item were removed. If alpha improves after removing an item, review that item carefully before deleting it.
How to Interpret Cronbach’s Alpha
Cronbach’s alpha should be interpreted as a guide, not as an automatic pass-or-fail result. A common interpretation is:
- Below .60: weak scale reliability
- .60–.69: questionable
- .70–.79: acceptable
- .80–.89: good
- .90 and above: very high, but possible item redundancy
These cutoffs are not universal rules. A nursing dissertation should interpret alpha based on the number of items, sample size, construct, questionnaire source, and study design.
For example, an alpha of .68 in an exploratory student project may be discussed differently from an alpha of .68 in a validated clinical scale expected to perform strongly. Likewise, an alpha of .94 may look impressive but could indicate that several items are asking nearly the same thing.
Do not report alpha alone. Read it with item-total statistics, item wording, missing data, reverse coding, and subscale structure. A responsible interpretation explains both the value and the quality of the items behind that value.
Item-Total Statistics and “Alpha if Item Deleted”
Item-total statistics help you identify weak or poorly fitting items. However, you should not delete an item only because SPSS suggests that alpha may increase.
First, check the item wording. A confusing question can reduce its relationship with the rest of the scale. Second, confirm that reverse coding was done correctly. Many low item-total correlations happen because a negatively worded item was coded in the wrong direction.
Third, consider the questionnaire structure. Some instruments include items that capture different but necessary parts of a construct. Removing those items may increase alpha but weaken the meaning of the scale.
If you remove an item, explain why. A strong dissertation result should state what was removed, why it was removed, and how the final reliability value changed.
Confused by low alpha, weak item-total correlations, or “alpha if item deleted”? Our Dissertation Data Analysis Help service can help you interpret and report the results correctly.
Common Mistakes in SPSS Reliability Analysis
Common mistakes include:
- Running Cronbach’s alpha on unrelated items
- Forgetting to reverse-code negative items
- Mixing separate subscales in one analysis
- Deleting items only to raise alpha
- Treating reliability as validity
- Reporting alpha without naming the scale
- Ignoring missing data
- Using reliability analysis for single-item variables
- Copying SPSS tables without interpretation
The goal is not to force the highest possible alpha. The goal is to decide whether the scale is consistent enough for the study purpose and to report that decision clearly.
How to Report Cronbach’s Alpha in APA Format
Cronbach’s alpha reporting APA style should be brief, clear, and tied to the scale being tested. Report the scale or subscale name, number of items, alpha value, whether any item was removed, and a short interpretation. APA Style guidance emphasizes clear reporting of numbers and statistics in research writing (American Psychological Association, 2024).
Example 1:
The medication adherence scale showed acceptable reliability, Cronbach’s α = .78.
Example 2:
Patient education confidence scale demonstrated good reliability, Cronbach’s α = .84, based on eight items.
Example 3:
The initial reliability analysis produced weak reliability, Cronbach’s α = .58. Item-total statistics were reviewed to identify possible poorly performing items.
Example 4:
After one reverse-coded item was corrected, the nursing confidence scale showed acceptable reliability, Cronbach’s α = .76.
A stronger dissertation-style paragraph may look like this:
“The 10-item patient education confidence scale was assessed for reliability before computing the total score. The scale demonstrated good reliability, Cronbach’s α = .82. Item-total statistics were reviewed, and no item produced a meaningful improvement in alpha if deleted. Therefore, all 10 items were retained for the final scale score.”
This paragraph is stronger than reporting alpha alone because it explains the scale tested, the number of items, the reliability value, the item review, and the decision made.
SPSS Reliability Analysis Example for Nursing Research
A nursing student uses a 10-item patient education confidence scale. Each item is measured on a 5-point Likert scale, where higher scores indicate greater confidence in providing patient education.
Before creating a total confidence score, the student runs Cronbach’s alpha in SPSS. The Reliability Statistics table shows Cronbach’s α = .82 for 10 items. This suggests good reliability for the scale in this sample.
The student then checks the Item-Total Statistics table. No item has a clearly weak corrected item-total correlation, and the “Cronbach’s alpha if item deleted” column does not show a meaningful improvement if any item is removed.
In the dissertation results chapter, the student could write:
“The 10-item patient education confidence scale demonstrated good reliability, Cronbach’s α = .82. Item-total statistics were reviewed, and no items were removed.”
This is stronger than pasting the SPSS table because it reports the value, names the scale, identifies the number of items, and explains the item review.
How Reliability Analysis Supports Quantitative Nursing Research
Reliability analysis often comes before further quantitative analysis. Once a multi-item scale shows acceptable reliability, the student can create a total or average score for later analysis.
These scale scores may then support descriptive statistics, correlation, independent-samples t-tests, paired-samples t-tests, ANOVA, regression, and other inferential procedures. This connects with broader Types of Quantitative Data Analysis because reliability testing prepares questionnaire scores for meaningful statistical use.
However, reliability does not make a scale automatically valid or clinically important. It only supports the decision to use related items together as a score.
When to Get Help With SPSS Reliability Analysis
Get help when the reliability output creates a decision you cannot defend clearly in your results chapter. This often happens when Cronbach’s alpha is low, a supervisor rejects the first reliability write-up, or SPSS excludes more cases than expected because of missing data.
Support is also useful when reverse-coded items make the output confusing. A negative or weak item-total correlation may reflect a poor item, but it may also mean the item was coded in the wrong direction. Deleting the item too quickly can create problems later, especially if the questionnaire has an established structure.
Students also struggle when “Cronbach’s alpha if item deleted” seems to suggest removing several items. In that situation, you need to decide whether the issue is wording, coding, subscale mixing, sample size, or a true item problem.
Professional SPSS support can help you check the dataset, separate subscales, correct reverse coding, interpret item-total statistics, respond to supervisor comments, and write a results section that is accurate and defensible.
Conclusion
SPSS reliability analysis helps nursing students check whether questionnaire items can be used together before creating total scores or subscale scores. Cronbach’s alpha is useful, but it should not be interpreted alone. You should also review item-total statistics, “Cronbach’s alpha if item deleted,” item wording, reverse coding, missing data, subscale structure, and the study context.
A strong reliability section does more than report one number. It explains what scale was tested, how many items were included, what the alpha value showed, and whether any item needed correction, review, or removal.
Need expert help with SPSS reliability analysis? Upload your dataset, questionnaire, research questions, and rubric through our SPSS Data Analysis Help page for focused nursing research support.
FAQs
1. What is SPSS reliability analysis?
SPSS reliability analysis is a procedure used to check whether multiple related questionnaire items work well together as a scale or subscale.
2. What is Cronbach’s alpha in SPSS?
Cronbach’s alpha in SPSS is a statistic that estimates how consistently related items behave as a group. It is commonly used for Likert-scale questionnaires.
3. What Cronbach’s alpha value is acceptable?
Many nursing dissertations treat .70 or higher as acceptable, but this is only a guide. Alpha should be interpreted based on the scale, number of items, sample size, and study context.
4. Can I delete an item to improve Cronbach’s alpha?
You should delete an item only when there is a clear reason. Check item wording, reverse coding, corrected item-total correlation, theory, and supervisor guidance before removing any item.
5. How do I report Cronbach’s alpha in APA format?
Report the scale name, number of items, Cronbach’s alpha value, and a brief interpretation. Example: “The medication adherence scale showed acceptable reliability, Cronbach’s α = .78.”
References
American Psychological Association. (2024). Numbers and statistics guide.
IBM Corp. (n.d.). Reliability analysis. IBM Documentation.
Tavakol, M., & Dennick, R. (2011). Making sense of Cronbach’s alpha. International Journal of Medical Education, 2, 53–55.
