


A nurse researcher tests a new postoperative pain-education program on 3,000 surgical patients. Patients in the program report average pain scores 0.3 points lower on a 0–10 scale than patients receiving usual care, with p < .001. The result is statistically significant. But would a patient notice a third of a point? Would a ward change its practice for it?
This is the central tension behind statistical significance. A significant result tells you that the data would be unusual if there were truly no difference. It does not tell you that the difference is large, important, or worth acting on. Nursing students meet this problem constantly: in journal articles, in evidence-based practice appraisals, and in their own SPSS output.
This guide explains what statistical significance means, how to interpret it correctly, and how to report it in a nursing dissertation without overclaiming.
All examples in this article are hypothetical. The numbers were constructed to illustrate reasoning and do not come from any real study.
What Is Statistical Significance?
Statistical significance is the conclusion a researcher reaches when a study’s p-value falls below a significance level (alpha) chosen before the analysis. It means the observed result would be unusual if the null hypothesis and the test’s assumptions were true. It does not mean the result is large, important, or certainly real.
The word “significant” causes much of the confusion. In everyday English it means important. In statistics it means only unlikely enough under a specified null model to cross a prespecified threshold (Wasserstein & Lazar, 2016).
Three ingredients must be in place before the word applies:
- A null hypothesis. This is usually a statement of no difference, no association, or no effect.
- A statistical model. This is the test and its assumptions, such as independent observations and an appropriate distribution.
- A decision threshold. This is alpha, set in advance and commonly .05.
A simple example. A surgical ward compares postoperative pain scores between patients who received a nurse-led education session and patients who received usual care. The null hypothesis says that, in the population, average pain is the same in both groups. If the observed gap would be rare under that assumption, and the p-value falls below the chosen alpha, the difference is called statistically significant. Whether the gap is big enough to matter to patients is a separate question.
Understanding Statistical Significance and P-Values
What a p-value represents
A p-value is the probability, assuming the null hypothesis and all the model’s assumptions are true, of obtaining a result at least as extreme as the one observed (Greenland et al., 2016). Small p-values mean the data fit poorly with the null model. Large p-values mean the data are reasonably compatible with it.
The p-value is the input. Statistical significance is the verdict reached by comparing that input with alpha.
Why .05?
The .05 threshold is a convention, not a law of nature. It became standard through early 20th-century statistical practice, and the ASA has stressed that scientific conclusions should not rest on whether a p-value crosses any particular line (Wasserstein et al., 2019).
Other thresholds are used where the consequences justify them. A group of 72 methodologists proposed .005 for claims of new discoveries in fields where .05 is the default (Benjamin et al., 2018). Studies running many tests may adjust alpha downward. Whatever threshold is used, it should be justified and fixed before the data are analyzed.
Interpreting p against a prespecified alpha (α = .05)
| Result | Conventional decision | What you can say | What you cannot say |
|---|---|---|---|
| p < .05 | Reject H0 | The result is statistically significant at the .05 level | “The intervention works” or “H0 is false” |
| p = .05 exactly | Follow the rule stated in your analysis plan (many texts reject when p ≤ α) | Report the exact value and the rule applied | That p = .049 and p = .051 are meaningfully different evidence |
| p > .05 | Fail to reject H0 | The data did not provide sufficient evidence against H0 at this threshold | “There is no effect” or “the groups are equal” |
Two misreadings to avoid
- The p-value is not the probability that the null hypothesis is true. It is calculated assuming H0 is true, so it cannot also measure the chance that H0 is true.
- The p-value is not the probability that the results occurred “by chance.” It describes how surprising the data would be under one specific model. It does not assign a probability to chance itself as the explanation.
For SPSS output, exact-value reporting, and a longer list of p-value pitfalls, see our guide to interpreting p-values in nursing research.
Statistical Significance in Hypothesis Testing
Statistical significance is the end point of a null hypothesis significance test. The pieces fit together like this:
| Element | Role | Pain-education example |
|---|---|---|
| Null hypothesis (H0) | The “no effect” claim being tested | Mean pain is equal in both populations |
| Alternative hypothesis (H1) | The competing claim | Mean pain differs between the populations |
| Alpha (α) | The prespecified threshold for rejecting H0 | .05, two-sided |
| Test statistic | Summarizes how far the data depart from H0 | A t statistic from an independent-samples t test |
| Reference distribution | Shows how the statistic would vary if H0 were true | The t distribution with the relevant degrees of freedom |
| P-value | Locates the observed statistic within that distribution | The probability of a t at least this extreme under H0 |
| Decision | Compares p with α | Reject or fail to reject H0 |
Two points matter most. First, researchers reject or fail to reject H0; they never “accept” it. Second, the decision concerns the null model only. It says nothing directly about the size of the effect.
For the full step-by-step logic, see what null hypothesis testing is and how it works. For formulas and worked calculations, see our guide on how to calculate statistical significance.
How Do Researchers Determine Whether a Result Is Statistically Significant?
The decision follows a fixed sequence. Here it is applied to a hypothetical study.
Scenario. A surgical unit randomly assigns 100 adults to a nurse-led preoperative pain-education session (n = 50) or usual care (n = 50). The primary outcome is self-reported pain on a 0–10 numeric rating scale 24 hours after surgery. Before collecting data, the team specifies a two-sided independent-samples t test with α = .05.
Hypothetical results.
- Education group: M = 4.20, SD = 1.70
- Usual care: M = 5.00, SD = 1.90
- Mean difference: 0.80 points lower in the education group, 95% CI [0.08, 1.52]
- t(98) = 2.22, p = .029
Decision. Because .029 is below the prespecified .05, the researchers reject H0. The difference is statistically significant.
What comes next. The decision is only the beginning. The confidence interval runs from 0.08 to 1.52 points. A reduction of 0.08 points would mean nothing to a patient. A reduction of 1.5 points might matter. The data are compatible with both. The significance verdict alone cannot settle whether this program is worth adopting.
Factors That Influence Statistical Significance
Whether a result crosses the threshold depends on several factors at once. No single factor determines it.
| Factor | How it affects significance |
|---|---|
| Sample size | Larger samples shrink standard errors, so smaller differences can reach significance. Very small samples may miss important effects. |
| Effect magnitude | Larger true differences are easier to detect. |
| Variability | Noisy data (large SDs) widen uncertainty and make significance harder to reach. |
| Study design | Paired or repeated-measures designs, stratification, and covariate adjustment can increase precision. |
| Measurement quality | Unreliable instruments add noise and weaken the ability to detect real differences. |
| Statistical power | The probability of detecting a specified true effect. Low power raises the risk of a false negative. |
| Test assumptions | Violated assumptions can make p-values misleading in either direction. |
| Multiple testing and analytic flexibility | Running many tests, or making unplanned choices after seeing the data, inflates the chance of false positives (Simmons et al., 2011). |
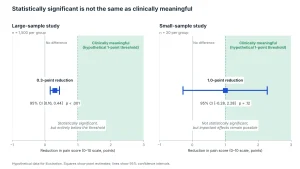
The sample-size point deserves emphasis. In the opening example, 3,000 patients made a 0.3-point difference highly significant. With only 40 patients, a full 1-point difference might not reach significance. Significance is partly a statement about how much data you collected, not purely about how strong the effect is.
A significant result is also not automatically reliable. A biased design or selective reporting can produce small p-values that do not reflect any real effect. For planning sample size before data collection, see our guide to power analysis for nursing research.
Not sure your results chapter interprets significance correctly? Our inferential statistics help for nursing research covers test selection, assumption checks, and interpretation.
Statistical Significance vs Clinical Significance
This is the distinction that matters most in nursing. Statistical significance concerns evidence against a null hypothesis. Clinical significance concerns whether a finding is large and meaningful enough to change care for patients (Ranganathan et al., 2015).
| Feature | Statistical significance | Clinical significance |
|---|---|---|
| Meaning | The data are unusual under the null model at the chosen alpha | The effect matters to patients, practice, or outcomes |
| Typical evidence | P-value compared with alpha | Effect size, confidence interval, clinically important thresholds, patient-reported benefit |
| Driven by | Effect size, sample size, variability, design | Outcome importance, magnitude, risks, costs, burden, patient values |
| Determined by | A statistical rule | Clinical and professional judgment informed by evidence |
| Nursing example | A 0.3-point pain reduction with p < .001 in 3,000 patients | Whether a pain reduction is large enough for patients to notice and value |
A hypothetical example
Return to the 3,000-patient study. Suppose the education group (n = 1,500) has a mean pain score of 4.3 and usual care (n = 1,500) has 4.6, both with SD = 2.0. The test gives t(2998) = 4.11, p < .001, and the 95% CI for the difference is [0.16, 0.44].
Now suppose, hypothetically, that the research team had specified in advance that a 1-point reduction is the smallest change worth acting on for this scale and population. Every value in the confidence interval falls well below that threshold. The result is highly statistically significant but not clinically significant: the data rule out any reduction large enough to matter.
What clinical importance depends on
There is no formula for clinical significance. It depends on:
- The outcome. A small reduction in mortality may matter more than a large change in satisfaction scores.
- The context. The same change may matter in palliative care but not in day surgery.
- Patient preferences. What patients themselves consider a worthwhile improvement.
- Intervention burden, costs, and risks. A tiny benefit may justify a cheap, safe change but not an expensive or risky one.
- Established clinical thresholds. Where a validated minimal clinically important difference exists for that instrument and population, use it. Do not borrow one from an unrelated population.
Nursing statisticians have urged the profession to move beyond reliance on the p < .05 threshold for exactly these reasons (Hayat et al., 2019).
Statistical Significance vs Practical Significance
Practical significance is the broader idea: does a finding matter for a real-world decision? Clinical significance is practical significance applied to patient care. Practical significance also covers nursing education, workforce, and health-system outcomes, where the people affected may be nurses, students, or managers rather than patients.
Examples include:
- A new orientation program raises nurse knowledge scores by 2 points out of 100. Even if significant, does that justify an extra training day?
- A staffing change reduces average overtime by four minutes per shift. Does that affect fatigue, retention, or budget enough to matter?
Effect size is the bridge between the two kinds of significance. It quantifies magnitude, but magnitude alone still needs a judgment about what size is worth acting on in that setting.
Statistical Significance vs Effect Size
Statistical significance answers: Are the data unusual under the null model? Effect size answers: How large is the difference or association? (Sullivan & Feinn, 2012).
Common effect-size measures include:
- Mean difference in the original units (for example, 0.8 points on a pain scale). This is often the most interpretable.
- Cohen’s d. A standardized mean difference in standard-deviation units.
- Correlation coefficient (r). The strength and direction of a linear association.
- Odds ratio or risk ratio. For binary outcomes such as infection or readmission.
Effect sizes help in three ways. They show whether a result is trivial or substantial. They allow comparison across studies. And they are needed for power calculations and meta-analysis.
A tiny p-value does not mean a large effect. In the hypothetical examples above, the 3,000-patient study had a much smaller p-value (p < .001) than the 100-patient study (p = .029). Yet its standardized effect was much smaller: d ≈ 0.15 versus d ≈ 0.44.
For formulas, paired-design variants, and reporting, see our full guide to Cohen’s d effect size.
Statistical Significance vs Confidence Intervals
A confidence interval (CI) gives a range of values for the population effect that are reasonably compatible with the data, given the model. Where a p-value gives a single yes-or-no-style signal, the CI shows both magnitude and precision.
How to read it:
- Width shows precision. Narrow intervals mean precise estimates; wide intervals mean substantial uncertainty.
- Location shows magnitude. Compare the whole interval with what would be clinically meaningful, not just with zero.
How CIs relate to significance
For many common tests, such as a two-sided t test for a mean difference, a 95% CI that excludes the null value (zero for a difference, one for a ratio) corresponds to p < .05. That correspondence holds when the interval and test are built from the same model. It does not hold automatically for every parameter, interval method, or test. Some intervals, such as certain intervals for proportions or effect sizes, are constructed differently from the corresponding test.
A common error
A 95% CI does not mean there is a 95% probability that the true value lies inside this particular interval. The population value is fixed. The 95% describes the long-run behavior of the method: if the study were repeated many times and an interval calculated each time, about 95% of those intervals would contain the true value, provided the model is correct (Greenland et al., 2016).
Type I and Type II Errors
Because decisions rest on sample data, both kinds of wrong conclusion are possible.
| Error | Definition | Linked to | Nursing example | Consequence |
|---|---|---|---|---|
| Type I (false positive) | Rejecting a true H0 | Alpha: when H0 is true, the long-run rate equals α | Concluding that a hand-hygiene campaign reduced infections when it did not | Resources spent on an ineffective intervention |
| Type II (false negative) | Failing to reject a false H0 | Beta (β); power = 1 − β | Missing a real benefit of an early-mobility protocol because the sample was too small | A useful intervention is abandoned |
Lowering alpha reduces Type I errors but, with sample size fixed, raises the risk of Type II errors. Adequate sample size planned in advance is the main way to keep both acceptably low.
Statistical Significance in Nursing and Healthcare Research
The scenarios below are hypothetical. For each one, the key questions are what a significant result could mean, what it would not establish, and what else to examine.
Nursing intervention and patient outcomes
A nurse-led early-mobility protocol is associated with a significantly shorter length of stay.
- Could mean: The observed difference would be unusual if the protocol had no association with length of stay.
- Would not establish: That the protocol caused the difference, unless the design supports causal inference (for example, randomization).
- Also examine: The mean difference in days and its CI, baseline comparability, and confounders such as admission severity.
Medication adherence
Adherence scores are significantly higher after a pharmacist–nurse follow-up call.
- Could mean: Evidence against “no change in adherence score.”
- Would not establish: That patients’ clinical outcomes, such as blood pressure, improved.
- Also examine: Whether self-report bias affects the scale, how big the change is relative to the scale range, and whether the effect lasts.
Infection prevention
Catheter-associated infection rates differ significantly before and after a bundle is introduced.
- Could mean: The before–after change is unusual under the null model.
- Would not establish: That the bundle produced the change. Secular trends, seasonal variation, or changes in surveillance definitions could contribute.
- Also examine: The absolute risk difference, the rate ratio and its CI, the comparison period, and whether a control unit was used.
Patient education
Discharge-education knowledge scores improve significantly.
- Could mean: Knowledge scores changed more than expected under the null model.
- Would not establish: That behavior or readmissions changed.
- Also examine: Ceiling effects, test–retest familiarity, and the size of the change in points.
Quality improvement
Medication-error reports fall significantly after a barcode-scanning rollout.
- Could mean: The decline is unusual under a no-change model.
- Would not establish: That true errors fell. Reporting behavior may have changed instead.
- Also examine: Data-collection consistency, run or control charts, and whether repeated monthly testing inflates false positives.
Patient satisfaction or quality of life
Quality-of-life scores differ significantly between two follow-up models.
- Could mean: Evidence of a group difference on the scale.
- Would not establish: That patients would notice or value the difference.
- Also examine: Validated clinically important thresholds for that instrument, missing data, and response bias.
How to Interpret Statistically Significant and Nonsignificant Results
Interpretation should combine the p-value with the effect estimate, its confidence interval, the study’s power, and its design.
| Result pattern | Hypothetical example | Sound interpretation |
|---|---|---|
| Significant, small effect | 0.3-point pain reduction, 95% CI [0.16, 0.44], p < .001 | Precisely estimated but too small to matter; not clinically significant |
| Significant, potentially meaningful effect | 0.8-point reduction, 95% CI [0.08, 1.52], p = .029 | Evidence of a reduction; the true effect could be trivial or meaningful, so replication would help |
| Nonsignificant, wide CI | 1.0-point reduction, 95% CI [−0.28, 2.28], p = .12 (n = 20 per group) | Inconclusive: data are compatible with slight harm, no effect, or a large benefit |
| Nonsignificant, narrow CI near zero | 0.05-point difference, 95% CI [−0.15, 0.25], large sample | Data are compatible only with small effects in either direction; any important effect appears unlikely |
The third row is the most commonly misread. With only 20 patients per group, a 1-point reduction (potentially important) failed to reach significance. Concluding “the program does not work” would be wrong. The study was simply too imprecise to say. As Altman and Bland put it, absence of evidence is not evidence of absence (Altman & Bland, 1995). In a review of 791 articles, Amrhein and colleagues reported that roughly half wrongly treated nonsignificance as showing no effect (Amrhein et al., 2019).
Failing to reject H0 does not prove H0 true. Showing that an effect is negligible requires a design built for that purpose, such as an equivalence or non-inferiority study.
Common Misconceptions About Statistical Significance
- “p < .05 proves my hypothesis.” It only indicates that the data are unusual under H0, given the model. Bias, confounding, or a misspecified model could also explain the result.
- “p is the probability H0 is true.” The p-value is calculated assuming H0 is true. It cannot be the probability of H0.
- “Significant means clinically important.” Large samples can make trivial differences significant.
- “Nonsignificant means no effect.” Underpowered studies often miss real effects. Report the CI and discuss power.
- “I only need the p-value.” Without the effect size and CI, readers cannot judge magnitude or precision.
- “Testing everything is thorough.” Running many comparisons and reporting only significant ones inflates false positives. Prespecify primary analyses, adjust for multiplicity where appropriate, and report all planned tests.
- “Significant means causal.” Causation depends on design, not on the p-value. Observational associations can be highly significant and still be confounded.
- “p = .049 is real; p = .051 is nothing.” These represent nearly identical evidence. A threshold is a decision rule, not a boundary between meaningful and meaningless results.
How to Report Statistical Significance in a Nursing Dissertation
What to report
Following APA 7th edition style (American Psychological Association, 2020):
- The test used, such as an independent-samples t test, chi-square test of independence, or one-way ANOVA.
- Descriptive statistics for each group: means and SDs, or counts and percentages.
- The test statistic and degrees of freedom, such as t(98), χ²(1, N = 240), or F(2, 147).
- The exact p-value to two or three decimals (p = .029). Use p < .001 for very small values. Never write p = .000. Italicize p, t, F, M, and SD in your final document.
- An effect size and its confidence interval when relevant, ideally including the raw mean difference.
- A plain-language interpretation linked to the research question.
Formats vary by test. A chi-square result, an ANOVA, and a regression coefficient each have their own conventions, so follow the convention for the test you used.
Hypothetical example of a strong results paragraph
An independent-samples t test compared 24-hour postoperative pain scores between patients who received nurse-led preoperative education (M = 4.20, SD = 1.70, n = 50) and patients who received usual care (M = 5.00, SD = 1.90, n = 50). Patients in the education group reported lower pain, mean difference = 0.80 points, 95% CI [0.08, 1.52], t(98) = 2.22, p = .029, d = 0.44, 95% CI [0.05, 0.84]. Although the difference was statistically significant, the confidence interval included reductions too small to be clinically meaningful, as well as reductions that may matter to patients.
Why this paragraph works
- It names the test and groups and provides descriptive statistics first.
- It states the direction of the difference in words (“reported lower pain”).
- It gives the raw difference with a CI in the scale’s own units, which readers can interpret clinically.
- It reports the exact p-value and a labeled effect size with its CI.
- It does not overclaim: it flags the uncertainty rather than declaring that the program “works.”
Chapter 4 vs Chapter 5
In Chapter 4 (Results), report what the analysis found, including nonsignificant results for every planned test. In Chapter 5 (Discussion), interpret the findings using effect sizes, CIs, clinical relevance, study limitations, and the existing literature. Statistical significance should never be the only basis for conclusions or practice recommendations.
For broader guidance, see how to present research findings.
Need a second set of eyes on your results chapter? Our dissertation data analysis help service supports students with test selection, SPSS output interpretation, and APA-style reporting.
Frequently Asked Questions About Statistical Significance
What does statistical significance mean in simple terms?
It means the result would be unusual if there were truly no difference or association, and it crossed a threshold set in advance. It is a statement about evidence against “no effect,” not about importance.
What does p < .05 mean?
It means that, if the null hypothesis and the test’s assumptions were true, a result at least this extreme would occur less than 5% of the time. With α = .05, the result is called statistically significant.
Is p = .05 statistically significant?
It depends on the rule stated in your analysis plan. Many texts and software conventions reject H0 when p ≤ α. Report the exact value and the rule you applied, and remember that p = .05 is borderline evidence either way.
Can a result be statistically significant but clinically insignificant?
Yes. Large samples can make very small differences significant. Compare the effect size and its confidence interval with what would matter to patients.
Does p > .05 mean there is no effect?
No. It means the study did not find sufficient evidence against the null hypothesis at that threshold. The confidence interval shows which effects remain plausible.
What is the difference between statistical significance and effect size?
Statistical significance indicates whether the data are unusual under the null model. Effect size measures how large the difference or association is. You need both.
Can SPSS determine statistical significance?
SPSS calculates test statistics and p-values, labeled “Sig.” in output tables. It cannot decide whether the result is clinically meaningful, whether the right test was used, or whether assumptions were met. Those judgments are yours. See our SPSS data analysis help if your output is confusing.
What should researchers consider alongside statistical significance?
Effect size, confidence intervals, study design and risk of bias, statistical power, assumption checks, the number of tests performed, and clinical relevance.
Conclusion
Statistical significance is one useful piece of evidence, not a verdict on whether a finding is true or important. A significant p-value says the data would be unusual under “no effect.” It does not measure how large the effect is, whether it matters to patients, or whether the study design supports a causal claim. A nonsignificant p-value does not prove that nothing happened.
Sound interpretation in nursing research combines the p-value with the effect size, its confidence interval, the quality of the study design, and a clear judgment about clinical relevance.
If you are working through results for a dissertation, DNP project, or thesis and want support choosing tests, interpreting output, or reporting findings accurately, explore our dissertation data analysis help.
Interested in how significance testing is applied in behavioral research? Read statistical significance in psychology
References (APA 7th Edition)
Altman, D. G., & Bland, J. M. (1995). Absence of evidence is not evidence of absence. BMJ, 311(7003), 485. https://doi.org/10.1136/bmj.311.7003.485
American Psychological Association. (2020). Publication manual of the American Psychological Association (7th ed.). https://doi.org/10.1037/0000165-000
Amrhein, V., Greenland, S., & McShane, B. (2019). Scientists rise up against statistical significance. Nature, 567(7748), 305–307. https://doi.org/10.1038/d41586-019-00857-9
Benjamin, D. J., Berger, J. O., Johannesson, M., Nosek, B. A., Wagenmakers, E.-J., Berk, R., Bollen, K. A., Brembs, B., Brown, L., Camerer, C., Cesarini, D., Chambers, C. D., Clyde, M., Cook, T. D., De Boeck, P., Dienes, Z., Dreber, A., Easwaran, K., Efferson, C., . . . Johnson, V. E. (2018). Redefine statistical significance. Nature Human Behaviour, 2(1), 6–10. https://doi.org/10.1038/s41562-017-0189-z
Greenland, S., Senn, S. J., Rothman, K. J., Carlin, J. B., Poole, C., Goodman, S. N., & Altman, D. G. (2016). Statistical tests, P values, confidence intervals, and power: A guide to misinterpretations. European Journal of Epidemiology, 31(4), 337–350. https://doi.org/10.1007/s10654-016-0149-3
Hayat, M. J., Staggs, V. S., Schwartz, T. A., Higgins, M., Azuero, A., Budhathoki, C., Chandrasekhar, R., Cook, P., Cramer, E., Dietrich, M. S., Garnier-Villarreal, M., Hanlon, A., He, J., Hu, J., Kim, M., Mueller, M., Nolan, J. R., Perkhounkova, Y., Rothers, J., . . . Ye, S. (2019). Moving nursing beyond p < .05. Nursing Outlook, 67(5), 509–510. https://doi.org/10.1016/j.outlook.2019.06.010
Ranganathan, P., Pramesh, C. S., & Buyse, M. (2015). Common pitfalls in statistical analysis: Clinical versus statistical significance. Perspectives in Clinical Research, 6(3), 169–170. https://doi.org/10.4103/2229-3485.159943
Simmons, J. P., Nelson, L. D., & Simonsohn, U. (2011). False-positive psychology: Undisclosed flexibility in data collection and analysis allows presenting anything as significant. Psychological Science, 22(11), 1359–1366. https://doi.org/10.1177/0956797611417632
Sullivan, G. M., & Feinn, R. (2012). Using effect size—or why the P value is not enough. Journal of Graduate Medical Education, 4(3), 279–282. https://doi.org/10.4300/JGME-D-12-00156.1
Wasserstein, R. L., & Lazar, N. A. (2016). The ASA statement on p-values: Context, process, and purpose. The American Statistician, 70(2), 129–133. https://doi.org/10.1080/00031305.2016.1154108
Wasserstein, R. L., Schirm, A. L., & Lazar, N. A. (2019). Moving to a world beyond “p < 0.05.” The American Statistician, 73(Suppl. 1), 1–19. https://doi.org/10.1080/00031305.2019.1583913
