

Many nursing students reach Chapter 4 with a research topic, survey data, clinical data, or an SPSS dataset, but then get stuck on one question: which statistical test should I use?
The confusion is common. A nursing project may involve pain scores, knowledge scores, medication adherence, patient satisfaction, fall risk, readmission status, pressure injury status, nurse burnout, hand hygiene compliance, blood pressure control, or Likert-scale survey responses. Depending on the research question and variable type, the correct test could be a t-test, chi-square test, ANOVA, correlation, regression, Mann-Whitney U test, Wilcoxon signed-rank test, Kruskal-Wallis test, Fisher’s exact test, McNemar’s test, or logistic regression.
Choosing the wrong test can lead to incorrect Chapter 4 results, weak interpretation, committee corrections, and APA 7th edition reporting errors. A test should match the research question, dependent variable, grouping or predictor variable, number of groups, data structure, assumptions, sample size, and approved analysis plan. Statistical test selection depends on design and data features, not simply on what looks familiar in SPSS (Ranganathan, 2021).
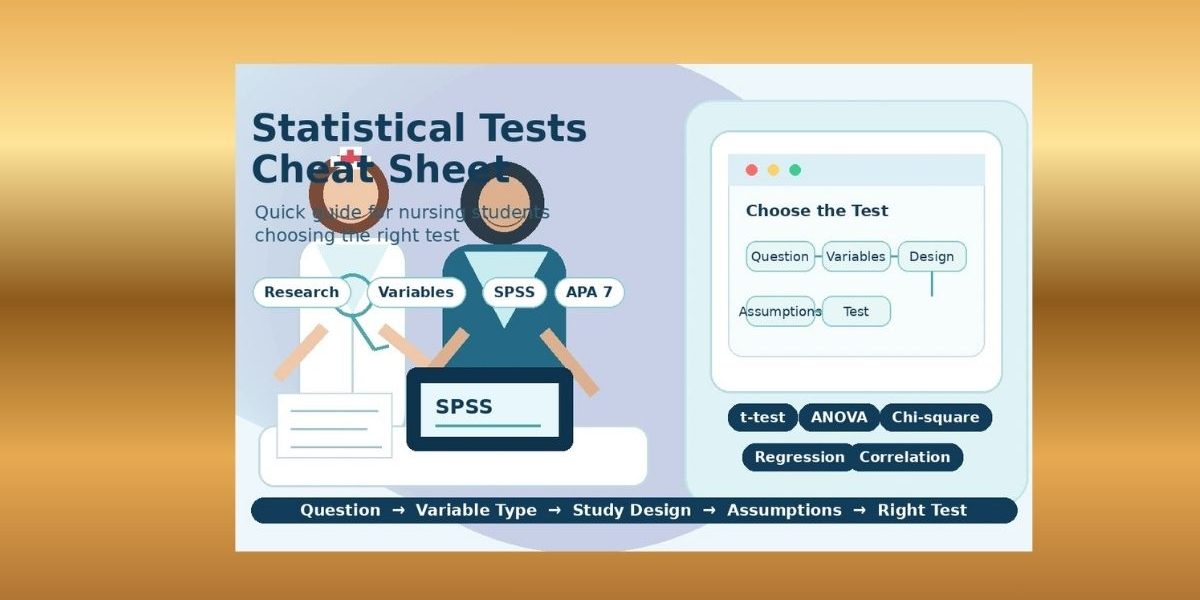
This statistical tests cheat sheet gives nursing students a quick, practical way to narrow the right test for dissertations, capstone projects, evidence-based practice projects, quality improvement projects, quantitative research assignments, and Chapter 4 data analysis.
Statistical Tests Cheat Sheet for Nursing Students
A statistical tests cheat sheet is a quick-reference guide for matching a nursing research question to possible tests. It helps you move from “I have data” to “I know which test family is likely appropriate.”
This page is designed for quick guidance. For a deeper explanation of test families, assumptions, SPSS interpretation, p-values, confidence intervals, effect sizes, clinical significance, and APA reporting, read the full article on statistical tests in nursing research.
Use this cheat sheet to narrow your options, but do not treat it as automatic approval for a test. Final test selection should still follow your approved research question, study design, variable measurement level, distribution, assumptions, sample size, and committee requirements.
Before Using the Cheat Sheet: Identify These Five Things
Most statistical test errors happen because students choose a test before defining their variables clearly. Before you open SPSS, identify five things: the research question, the dependent variable, the independent or grouping variable, the number of groups or time points, and the data structure.
| What to Identify | What It Means | Nursing Example |
|---|---|---|
| Research question | What your project is trying to compare, test, relate, or predict | Did discharge education improve medication knowledge? |
| Dependent variable | The outcome being measured or predicted | Pain score, anxiety score, adherence score, readmission status |
| Independent, grouping, or predictor variable | The factor used to compare, explain, or predict the outcome | Intervention group, age group, unit type, education completion |
| Number of groups or time points | Whether you have two groups, three groups, pre/post data, or repeated measures | Two patient groups, three wards, baseline and post-test |
| Data structure | Whether data are independent, paired, categorical, ordinal, or continuous | Pre/post scores, yes/no readmission, single Likert item, scale score |
For example, a pain score is often continuous, readmission status is usually categorical, and pre-test/post-test scores from the same participants are paired. Two different patient groups are independent. A single Likert item is usually ordinal, while a validated multi-item scale score may sometimes be analyzed as approximately continuous if the methodology and assumptions support that decision.
Students who need a broader foundation can review types of data analysis in quantitative research and inferential data analysis in nursing research.
Quick Statistical Test Selection Table
Use this table in three steps. First, find your research goal. Second, check the outcome variable and design. Third, confirm assumptions before running the test in SPSS.
| Research Goal | Outcome Variable | Design | Recommended Test | Nursing Example |
|---|---|---|---|---|
| Compare two independent group means | Continuous | Two unrelated groups | Independent samples t-test | Compare pain scores between intervention and control groups |
| Compare the same group before and after | Continuous | Paired pre/post | Paired samples t-test | Compare knowledge scores before and after discharge education |
| Compare three or more independent groups | Continuous | Three or more unrelated groups | One-way ANOVA | Compare satisfaction scores across three wards |
| Compare three or more repeated measurements | Continuous | Same participants over time | Repeated measures ANOVA | Compare anxiety scores at baseline, post-test, and follow-up |
| Compare two independent ordinal or non-normal outcomes | Ordinal or skewed continuous | Two unrelated groups | Mann-Whitney U test | Compare pain severity ratings between two groups |
| Compare paired ordinal or non-normal outcomes | Ordinal or skewed continuous | Paired pre/post | Wilcoxon signed-rank test | Compare adherence ratings before and after teaching |
| Compare three or more ordinal or non-normal groups | Ordinal or skewed continuous | Three or more unrelated groups | Kruskal-Wallis test | Compare satisfaction ratings across three clinics |
| Compare three or more ordinal or non-normal repeated scores | Ordinal or skewed continuous | Same participants over time | Friedman test | Compare confidence ratings across three simulation sessions |
| Test association between two categorical variables | Categorical | Independent groups | Chi-square test | Test whether readmission status is associated with discharge education completion |
| Test categorical association with small expected counts | Categorical | Independent groups, small cells | Fisher’s exact test | Test pressure injury status by mobility category in a small sample |
| Test paired yes/no change | Binary categorical | Same participants pre/post | McNemar’s test | Test whether hand hygiene compliance improved after training |
| Test relationship between two continuous variables | Continuous | Correlational | Pearson correlation | Test whether burnout score is related to job satisfaction score |
| Test relationship involving ordinal or non-normal variables | Ordinal or non-normal | Correlational | Spearman correlation | Test whether stress rating is related to sleep quality rating |
| Predict a continuous outcome | Continuous | Predictive | Linear regression | Predict satisfaction score from communication score |
| Predict a binary outcome | Binary | Predictive | Binary logistic regression | Predict readmission yes/no from comorbidity score |
| Predict an ordinal outcome | Ordered category | Predictive | Ordinal logistic regression | Predict low, moderate, or high satisfaction category |
| Analyze a summed Likert-scale score | Often treated as continuous if justified | Depends on design | t-test, ANOVA, correlation, or regression if assumptions support | Analyze total nurse burnout scale score |
| Analyze a single Likert item | Ordinal | Depends on design | Mann-Whitney U, Wilcoxon, Kruskal-Wallis, Friedman, Spearman, or ordinal logistic regression | Analyze one satisfaction item rated 1 to 5 |
This table gives likely tests, not automatic answers. Test selection may change because of non-normal data, small sample size, outliers, missing data, low expected cell counts, ordinal measurement, repeated measures, or committee-approved methodology. Chi-square and Fisher’s exact tests, for example, both apply to categorical data, but Fisher’s exact test is often preferred when expected counts are small (Kim, 2017).
Printable Statistical Tests Cheat Sheet Summary
This quick section works like a revision card. It can also be converted into a downloadable PDF, checklist, or image for students.
| If Your Study Wants To… | Start by Considering… |
|---|---|
| Compare two independent groups | Independent samples t-test or Mann-Whitney U test |
| Compare pre-test and post-test scores | Paired samples t-test or Wilcoxon signed-rank test |
| Compare three or more independent groups | One-way ANOVA or Kruskal-Wallis test |
| Compare three or more repeated measurements | Repeated measures ANOVA or Friedman test |
| Test categorical association | Chi-square test or Fisher’s exact test |
| Test paired yes/no change | McNemar’s test |
| Test relationship between two scores | Pearson or Spearman correlation |
| Predict a continuous outcome | Linear regression |
| Predict a yes/no outcome | Binary logistic regression |
| Predict an ordered category | Ordinal logistic regression |
| Analyze one Likert item | Usually consider ordinal or nonparametric options |
| Analyze a summed scale score | Consider parametric tests if justified by reliability, distribution, and assumptions |
The summary is useful for quick decision-making, but it should always be followed by assumption checking and a review of the approved methodology.
Cheat Sheet by Research Question Type
The easiest way to choose a statistical test is to start with the type of question. Nursing research questions usually ask about a difference, association, relationship, or prediction.
If Your Question Asks About a Difference
Difference questions ask whether groups or time points differ. They are common in nursing education interventions, patient outcome studies, simulation projects, capstones, EBP projects, and quality improvement evaluations.
| Nursing Question | Data Structure | Likely Test |
|---|---|---|
| Do pain scores differ between two treatment groups? | Continuous outcome; two independent groups | Independent samples t-test |
| Did knowledge scores improve after discharge education? | Continuous outcome; same participants pre/post | Paired samples t-test |
| Do satisfaction scores differ across three wards? | Continuous outcome; three independent groups | One-way ANOVA |
| Did anxiety scores change across three time points? | Continuous outcome; repeated measurements | Repeated measures ANOVA |
| Do ordinal pain ratings differ between two groups? | Ordinal/non-normal outcome; two independent groups | Mann-Whitney U test |
| Did ordinal adherence ratings improve after teaching? | Ordinal/non-normal outcome; paired data | Wilcoxon signed-rank test |
| Do ordinal satisfaction ratings differ across three clinics? | Ordinal/non-normal outcome; three independent groups | Kruskal-Wallis test |
| Did confidence ratings change across three sessions? | Ordinal/non-normal outcome; repeated data | Friedman test |
Use a t-test when there are two groups or two related measurements and the outcome is continuous with reasonable assumptions. Use ANOVA when comparing three or more groups or time points. Also, use nonparametric alternatives when the data are ordinal, skewed, strongly affected by outliers, or not suitable for parametric testing. Nonparametric tests are not inferior; they are often more appropriate when the data structure requires them (Nahm, 2016).
If Your Question Asks About an Association
Association questions usually involve categorical variables. These questions are common when analyzing readmission status, infection status, fall occurrence, pressure injury status, adherence category, unit type, or education completion.
| Nursing Question | Variables | Likely Test |
|---|---|---|
| Is readmission status associated with discharge education completion? | Two categorical variables | Chi-square test |
| Is medication adherence category associated with age group? | Two categorical variables | Chi-square test |
| Is infection status associated with unit type? | Two categorical variables | Chi-square or Fisher’s exact test |
| Is pressure injury status associated with mobility category in a small sample? | Two categorical variables with small expected counts | Fisher’s exact test |
| Did fall occurrence change before and after a protocol? | Paired yes/no outcome | McNemar’s test |
| Did adherence status improve before and after education? | Paired yes/no outcome | McNemar’s test |
Use chi-square when both variables are categorical and expected counts are adequate. Use Fisher’s exact test when expected cell counts are too small. Make use of McNemar’s test when the same participants have paired binary responses, such as yes/no before and yes/no after an intervention.
If Your Question Asks About a Relationship
Relationship questions ask whether two measured variables move together. They are common in nursing survey research, staff outcome research, public health nursing, and nursing education studies.
| Nursing Question | Variables | Likely Test |
|---|---|---|
| Is burnout related to job satisfaction? | Two continuous scores | Pearson correlation |
| Is age related to systolic blood pressure? | Two continuous variables | Pearson correlation |
| Is self-efficacy related to adherence score? | Two continuous or scale scores | Pearson or Spearman correlation |
| Is stress related to sleep quality? | Ordinal or non-normal variables | Spearman correlation |
| Is pain severity rating related to satisfaction rating? | Ordinal variables | Spearman correlation |
Use Pearson correlation when both variables are continuous, approximately linear, and not strongly affected by outliers. Use Spearman correlation when variables are ordinal, ranked, skewed, or monotonic but not clearly linear.
Correlation does not prove causation. If burnout and job satisfaction are related, that does not prove one caused the other. Study design, timing, confounding variables, and measurement quality still matter.
If Your Question Asks About Prediction
Prediction questions ask whether one or more variables estimate an outcome. These questions are common in nursing dissertations, healthcare outcome studies, public health projects, and advanced quantitative analysis.
| Nursing Question | Outcome Type | Likely Test |
|---|---|---|
| Does communication score predict patient satisfaction score? | Continuous outcome | Simple linear regression |
| Do age, BMI, and adherence predict systolic blood pressure? | Continuous outcome | Multiple linear regression |
| Does comorbidity score predict readmission? | Binary outcome | Binary logistic regression |
| Does nurse staffing predict fall occurrence? | Binary or count outcome | Logistic regression or another model depending on outcome |
| Does health literacy predict medication adherence score? | Continuous or scale outcome | Linear regression |
| Do predictors estimate low, moderate, or high satisfaction? | Ordered categorical outcome | Ordinal logistic regression |
Employ simple linear regression when there is one predictor and a continuous outcome. Use multiple linear regression when there are several predictors and a continuous outcome. Use binary logistic regression when the outcome has two categories, such as readmitted/not readmitted or controlled/uncontrolled blood pressure. Make use of ordinal logistic regression when the outcome has ordered categories.
Students who need more support with predictive designs can review predictive data analysis in healthcare research.
Parametric vs Nonparametric Statistical Tests Cheat Sheet
Parametric tests are commonly used for continuous outcomes when assumptions such as normality, independence, and similar variances are reasonable. Nonparametric tests are often used for ordinal data, skewed data, small samples, outliers, or data that violate assumptions.
| Parametric Test | Nonparametric Alternative | Use When | Nursing Example |
|---|---|---|---|
| Independent samples t-test | Mann-Whitney U test | Two independent groups; ordinal or non-normal outcome | Compare pain ratings between two patient groups |
| Paired samples t-test | Wilcoxon signed-rank test | Two paired measurements; ordinal or non-normal outcome | Compare anxiety scores before and after education |
| One-way ANOVA | Kruskal-Wallis test | Three or more independent groups; ordinal or non-normal outcome | Compare satisfaction ratings across three units |
| Repeated measures ANOVA | Friedman test | Three or more repeated measurements; ordinal or non-normal outcome | Compare confidence ratings across three simulation sessions |
| Pearson correlation | Spearman correlation | Ordinal, ranked, skewed, or monotonic relationship | Relate stress rating to sleep quality rating |
Nonparametric tests are not “bad,” “less academic,” or “less acceptable.” They may be the correct choice when the data are ordinal, skewed, affected by outliers, or unsuitable for a parametric test. The better question is not “Which test looks stronger?” but “Which test fits my research question and data?”
Statistical Tests for Common Nursing Data Types
Different nursing variables need different analysis options. Identifying the data type is often the fastest way to avoid choosing the wrong test.
Continuous Data
Continuous data are numerical variables that meaningfully vary across a range. Examples include pain score, blood pressure, length of stay, knowledge score, patient satisfaction total score, medication adherence scale score, and nurse burnout scale score.
Common tests for continuous data include t-tests, ANOVA, Pearson correlation, and linear regression. Nonparametric alternatives may be needed if the variable is skewed, ordinal-like, affected by outliers, or unsuitable for parametric analysis.
Categorical Data
Categorical data place participants into groups or categories. Examples include readmission yes/no, infection yes/no, fall occurrence yes/no, unit type, adherence category, pressure injury status, and blood pressure control status.
Common tests for categorical data include chi-square test, Fisher’s exact test, McNemar’s test, and logistic regression. Chi-square and Fisher’s exact test examine association between categorical variables. Logistic regression predicts a binary outcome from one or more predictors.
Ordinal Data and Likert-Scale Data
Ordinal data have ordered categories, but the distance between categories may not be equal. Likert-type data are common in nursing surveys, satisfaction questionnaires, confidence ratings, burnout items, and perception measures.
A single Likert item is one rating question. For example, “I am satisfied with care” may be rated from 1 = strongly disagree to 5 = strongly agree. A single Likert item is usually ordinal.
A summed or averaged Likert-scale score combines several items into a total or average score. For example, a 10-item patient satisfaction scale may produce a total satisfaction score. A validated multi-item scale score may sometimes be analyzed as approximately continuous depending on reliability, distribution, sample size, assumptions, and the approved analysis plan.
Possible tests for single Likert items or ordinal outcomes include Mann-Whitney U test, Wilcoxon signed-rank test, Kruskal-Wallis test, Friedman test, Spearman correlation, and ordinal logistic regression.
Possible tests for summed or averaged scale scores may include t-test, ANOVA, correlation, or regression if the analysis plan and assumptions support treating the score as approximately continuous.
Students should not automatically treat all Likert responses as continuous data. Test choice depends on whether the variable is a single item or a scale score, how it is distributed, how many response categories it has, and what the methodology section approved. Sullivan and Artino explain that Likert-type data require careful interpretation because ordinal responses are often misunderstood or analyzed without enough attention to measurement level (Sullivan & Artino, 2013).
Statistical Tests for Pre-Test and Post-Test Nursing Studies
Pre-test/post-test designs are common in nursing education, EBP, capstone, and DNP projects. They often evaluate whether knowledge, anxiety, confidence, adherence, or clinical practice indicators changed after an intervention.
| Pre/Post Situation | Outcome Type | Recommended Test | Nursing Example |
|---|---|---|---|
| Same participants, continuous normally distributed outcome | Continuous | Paired samples t-test | Knowledge before and after discharge education |
| Same participants, ordinal or non-normal outcome | Ordinal or skewed continuous | Wilcoxon signed-rank test | Anxiety rating before and after intervention |
| Same participants, categorical yes/no outcome | Binary categorical | McNemar’s test | Hand hygiene compliance before and after training |
| More than two repeated time points, continuous outcome | Continuous repeated | Repeated measures ANOVA | Knowledge at baseline, post-test, and follow-up |
| More than two repeated time points, ordinal or non-normal outcome | Ordinal or skewed repeated | Friedman test | Confidence rating across three teaching sessions |
Pre-test/post-test data are usually paired because the same participants are measured twice. Students should not use an independent samples t-test for paired pre/post data. The independent samples t-test is for two different groups, not the same participants measured before and after an intervention.
SPSS Statistical Tests Cheat Sheet
SPSS can run many statistical tests, but it does not choose the correct test automatically. Students must choose the test based on the research question, variables, design, assumptions, and approved methodology.
The menu paths below are general SPSS menu paths. Exact wording may vary slightly by SPSS version, institutional setup, or installed modules. IBM SPSS Statistics Base includes common procedures such as t-tests, ANOVA, correlation, regression, crosstabs, and nonparametric analysis (IBM Corp., 2024).
| Statistical Test | General SPSS Menu Path | What Students Should Check First |
|---|---|---|
| Independent samples t-test | Analyze > Compare Means > Independent-Samples T Test | Two independent groups, continuous outcome, normality, variance |
| Paired samples t-test | Analyze > Compare Means > Paired-Samples T Test | Same participants measured twice, continuous outcome, difference scores |
| One-way ANOVA | Analyze > Compare Means > One-Way ANOVA | Three or more independent groups, continuous outcome, variance assumption |
| Chi-square test | Analyze > Descriptive Statistics > Crosstabs | Two categorical variables, expected cell counts |
| Pearson correlation | Analyze > Correlate > Bivariate | Two continuous variables, linearity, outliers |
| Spearman correlation | Analyze > Correlate > Bivariate | Ordinal/non-normal variables, monotonic relationship |
| Linear regression | Analyze > Regression > Linear | Continuous outcome, predictors, linearity, residuals, multicollinearity |
| Logistic regression | Analyze > Regression > Binary Logistic | Binary outcome, coding, event counts, predictors |
| Nonparametric tests | Analyze > Nonparametric Tests | Ordinal/non-normal data, paired vs independent design |
If your SPSS screen looks different, confirm menu wording in your own SPSS version or institutional guide. The most important issue is not the menu path; it is whether the test fits the research question and data.
APA 7 Reporting Clues for Common Statistical Tests
This section gives quick APA 7 reporting clues, not a full APA reporting guide. APA guidance recommends reporting exact p-values when possible and using p < .001 for very small values rather than p = .000 (American Psychological Association, 2024).
| Test | What to Report in APA 7 | Compact Reporting Clue |
|---|---|---|
| t-test | t, df, p, means, CI, effect size if appropriate | t(58) = 2.41, p = .019 |
| ANOVA | F, df, p, effect size, post hoc result if needed | F(2, 87) = 4.52, p = .014 |
| Chi-square test | χ², df, N, p, effect size if appropriate | χ²(1, N = 120) = 5.76, p = .016 |
| Pearson correlation | r, df or N, p, CI if available | r(98) = −.34, p = .001 |
| Spearman correlation | ρ or rs, p | ρ = .42, p = .003 |
| Mann-Whitney U test | U, z if used, p, medians or ranks | U = 412.00, p = .021 |
| Wilcoxon signed-rank test | W or z, p, median change if relevant | z = −2.46, p = .014 |
| Linear regression | B, SE, β, t, p, R², CI | B = 2.31, p = .002, R² = .24 |
| Logistic regression | OR, 95% CI, p, model information | OR = 1.42, 95% CI [1.10, 1.83], p = .007 |
Students should interpret p-values alongside confidence intervals, effect sizes, sample size, assumptions, and clinical relevance. A statistically significant result is not automatically clinically meaningful. A non-significant result is not automatically useless. For more detail, read p-values in nursing research.
Common Mistakes When Using a Statistical Tests Cheat Sheet
A statistical tests cheat sheet helps you narrow options, but it cannot replace proper analysis planning.
The most common mistakes are choosing a test without identifying the dependent variable, ignoring whether groups are independent or paired, using a t-test for more than two groups, treating every Likert item as continuous, treating a single Likert item and a scale score as the same thing, ignoring normality, ignoring small sample size, ignoring expected counts in chi-square, running many tests without a research question, copying SPSS output without interpretation, reporting only p-values, and confusing statistical significance with clinical significance.
The safest approach is to use the cheat sheet as a starting point, then confirm the test using your research question, methodology chapter, variable coding, assumptions, sample size, and committee feedback.
When the Cheat Sheet Is Not Enough
A cheat sheet is useful when your project is simple. It may not be enough when your study has multiple variables, a small sample size, missing or messy data, unclear variable coding, repeated measures, regression, multiple outcomes, or a methodology section that does not match the research questions.
You should also seek support if your committee asks you to justify the test, your SPSS output is confusing, you are unsure whether to use parametric or nonparametric tests, or your Chapter 4 needs APA 7 tables and interpretation.
Nursing Dissertation Help can support students with statistical test selection, SPSS data analysis, nursing dissertation data analysis, capstone data analysis, evidence-based practice project data analysis, Chapter 4 results writing, and APA 7 results reporting. Students with datasets, SPSS output, supervisor feedback, or a partial results chapter can also review dissertation data analysis help.
Editor’s note: This cheat sheet is intended to help nursing students narrow possible statistical tests. Final test selection should be based on the approved research question, study design, variable measurement level, distribution, assumptions, sample size, and institutional or committee requirements.
FAQs About Statistical Tests Cheat Sheets
1. What is a statistical tests cheat sheet?
A statistical tests cheat sheet is a quick-reference guide that helps students match research questions, variables, study design, and data structure to possible statistical tests. It does not replace full data analysis planning, but it helps students narrow likely options before running SPSS.
2. How do I know which statistical test to use in nursing research?
Start by identifying the research question, dependent variable, independent or grouping variable, number of groups, level of measurement, and whether the data are independent or paired. Then check assumptions, sample size, distribution, and your approved methodology.
3. What statistical test should I use for pre-test and post-test nursing data?
If the same participants are measured before and after an intervention and the outcome is continuous with reasonable assumptions, use a paired samples t-test. If the outcome is ordinal or non-normal, consider the Wilcoxon signed-rank test. Suppose the outcome is paired yes/no data, use McNemar’s test.
4. What statistical test should I use for two independent groups?
For two independent groups with a continuous outcome, start with an independent samples t-test. If the outcome is ordinal, skewed, or not suitable for a t-test, consider the Mann-Whitney U test.
5. What statistical test should I use for three or more groups?
For three or more independent groups with a continuous outcome, start with one-way ANOVA. If the outcome is ordinal or not suitable for ANOVA, consider the Kruskal-Wallis test. For three or more repeated measurements, consider repeated measures ANOVA or Friedman test.
6. What statistical test should I use for categorical nursing data?
For two categorical variables, start with chi-square. If expected cell counts are small, use Fisher’s exact test. If the categorical outcome is paired yes/no data measured before and after an intervention, use McNemar’s test.
7. What statistical test should I use for Likert-scale nursing data?
For a single Likert item, consider ordinal or nonparametric methods such as Mann-Whitney U, Wilcoxon signed-rank, Kruskal-Wallis, Friedman, Spearman correlation, or ordinal logistic regression. For a summed or averaged validated scale score, parametric tests may be possible if assumptions and the analysis plan support treating the score as approximately continuous.
8. What is the difference between a single Likert item and a Likert-scale score?
A single Likert item is one rating question, such as “I am satisfied with care” rated from 1 to 5. It is usually ordinal. A Likert-scale score combines several items into a total or average score. A validated multi-item scale score may sometimes be treated as approximately continuous, depending on reliability, distribution, assumptions, and methodology approval.
9. What is the difference between parametric and nonparametric tests?
Parametric tests usually analyze continuous data and rely on assumptions such as normality and variance conditions. Nonparametric tests often analyze ordinal, ranked, skewed, or non-normal data. Nonparametric tests are not inferior; they may be the correct choice when assumptions are not met.
10. Can SPSS choose the correct statistical test for me?
No. SPSS can run many tests, but it cannot fully understand your research question, study design, variables, assumptions, or committee-approved methodology. Students must choose the test before interpreting SPSS output.
11. When should I ask for help choosing a statistical test?
Ask for help when your variables are unclear, your sample size is small, your data are missing or messy, your study has repeated measures or regression, your SPSS output is confusing, or your committee asks you to justify your statistical test. Getting help early can prevent Chapter 4 corrections later.
Conclusion
A statistical tests cheat sheet helps nursing students narrow the right test by looking at the research question, variable type, number of groups, data structure, assumptions, and analysis goal. It can quickly show whether your project may need a t-test, ANOVA, chi-square test, correlation, regression, Mann-Whitney U test, Wilcoxon signed-rank test, Kruskal-Wallis test, Fisher’s exact test, McNemar’s test, or logistic regression.
However, a cheat sheet is only a guide. It does not replace proper data analysis planning, SPSS assumption checking, variable coding, sample size review, APA 7 reporting, or committee requirements.
If you are unsure about statistical test selection, SPSS analysis, Chapter 4 tables, APA 7 reporting, or dissertation data interpretation, request expert help from Nursing Dissertation Help. Getting the analysis right before you write Chapter 4 can help you avoid preventable corrections, explain your findings clearly, and present results that match your approved nursing research project.
References
American Psychological Association. (2024). Number and statistics guide. https://apastyle.apa.org/instructional-aids/numbers-statistics-guide.pdf
IBM Corp. (2024). IBM SPSS Statistics Base 30. https://www.ibm.com/docs/SSLVMB_30.0.0/pdf/IBM_SPSS_Statistics_Base.pdf
Kim, H.-Y. (2017). Statistical notes for clinical researchers: Chi-squared test and Fisher’s exact test. Restorative Dentistry & Endodontics, 42(2), 152–155. https://doi.org/10.5395/rde.2017.42.2.152
Nahm, F. S. (2016). Nonparametric statistical tests for the continuous data: The basic concept and the practical use. Korean Journal of Anesthesiology, 69(1), 8–14. https://doi.org/10.4097/kjae.2016.69.1.8
Ranganathan, P. (2021). An introduction to statistics: Choosing the correct statistical test. Indian Journal of Critical Care Medicine, 25(Suppl 2), S184–S186. https://doi.org/10.5005/jp-journals-10071-23815
Sullivan, G. M., & Artino, A. R., Jr. (2013). Analyzing and interpreting data from Likert-type scales. Journal of Graduate Medical Education, 5(4), 541–542. https://doi.org/10.4300/JGME-5-4-18
UCLA Office of Advanced Research Computing. (n.d.). Choosing the correct statistical test in SAS, Stata, SPSS and R. https://stats.oarc.ucla.edu/other/mult-pkg/whatstat/
Wasserstein, R. L., & Lazar, N. A. (2016). The ASA statement on p-values: Context, process, and purpose. The American Statistician, 70(2), 129–133. https://doi.org/10.1080/00031305.2016.1154108
