

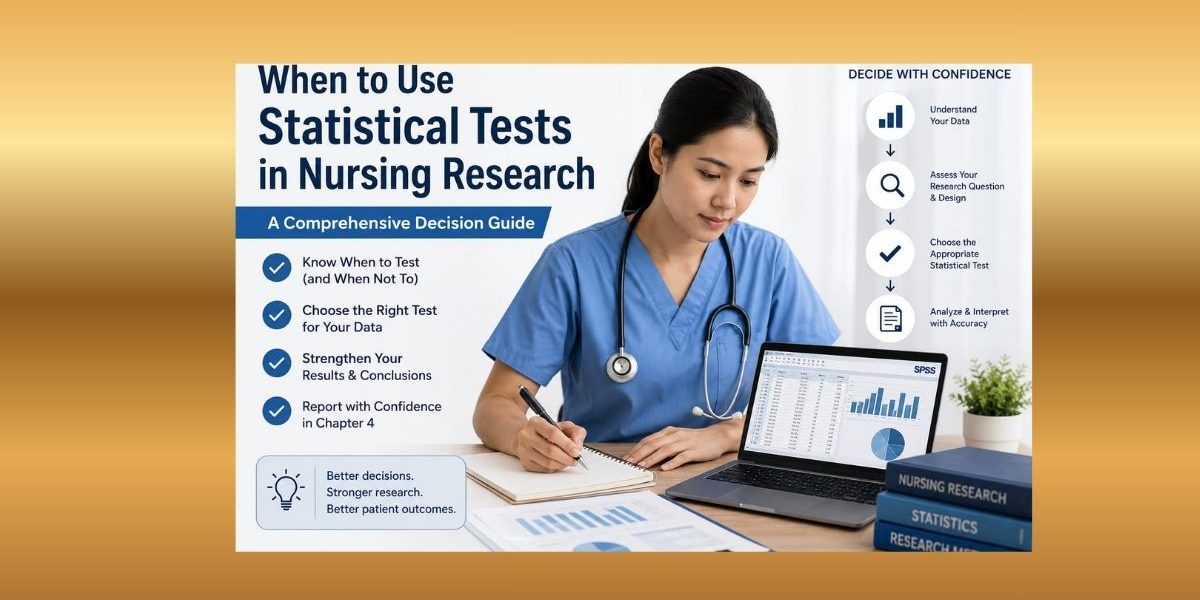
Many nursing students reach the data-analysis stage and ask one stressful question: Do I need a statistical test here?
Some students run too many tests because they think every Chapter 4 table needs a p-value. Others only report percentages, means, and standard deviations even when their research question requires inferential analysis. Both mistakes can weaken a nursing dissertation, capstone project, evidence-based practice project, or quality improvement report.
Using statistical tests at the wrong time can create confusing SPSS output, incorrect Chapter 4 results, weak interpretation, unnecessary committee corrections, and APA 7th edition reporting errors. A statistical test should be used when the research question asks for evidence about a difference, change, association, relationship, prediction, intervention effect, or hypothesis. Test selection should be guided by the research question, study design, variable type, assumptions, sample size, and approved analysis plan, not by guesswork or by copying another student’s project (Ranganathan, 2021).
This guide explains when to use statistical tests in nursing research, when descriptive statistics are enough, when a p-value may not be needed, and how to connect test choice to the research question, variables, study design, SPSS output, Chapter 4 writing, and APA 7 reporting.
What Does “When to Use Statistical Tests” Mean?
Deciding when to use statistical tests means deciding whether your research question requires more than a description of the sample.
Descriptive statistics answer questions such as, “What does the sample look like?” Statistical tests answer questions such as, “Is there evidence of a difference, change, association, relationship, prediction, or intervention effect?”
In nursing research, statistical tests are usually needed when the study asks whether pain scores differ between groups, knowledge scores improved after education, readmission status is associated with discharge education, nurse burnout is related to job satisfaction, comorbidity score predicts readmission, or a nursing education intervention affected patient knowledge.
Statistical tests help nursing students move beyond describing results and toward making an evidence-based conclusion about whether an observed pattern may be more than random variation. However, a statistical test does not prove truth, causation, or clinical importance by itself. A p-value must be interpreted with the study design, sample size, confidence intervals, effect sizes, assumptions, and practical meaning (Wasserstein & Lazar, 2016).
For a broader explanation of test types, assumptions, SPSS procedures, and APA reporting, read the full guide to statistical tests in nursing research.
When Descriptive Statistics Are Enough
Not every nursing research question requires a statistical test. Descriptive statistics may be enough when the goal is to summarize the sample, describe variables, or present baseline characteristics.
Descriptive statistics are usually enough when the question asks:
What percentage of participants were female?
What was the average age of nurses in the sample?
How many participants reported high medication adherence?
What was the mean patient satisfaction score?
What percentage of patients had controlled blood pressure at baseline?
What were the baseline clinical characteristics of the sample?
Descriptive statistics include frequencies, percentages, means, standard deviations, medians, interquartile ranges, and simple charts. They are essential in Chapter 4 because they help readers understand the participants, the setting, and the main variables before inferential analysis begins.
For example, a demographic table showing age, gender category, education level, years of experience, or unit type usually does not need a statistical test unless the research question specifically compares groups. A baseline characteristics table may describe the sample using percentages and means. A descriptive survey objective may only require response frequencies and summary scores.
The key distinction is simple: descriptive statistics answer, “What does the sample look like?” Statistical tests answer, “Is there evidence that a difference, association, relationship, change, or prediction exists?”
Students who need more background can review descriptive data analysis in nursing research and inferential data analysis in nursing research.
When Statistical Tests Are Needed
Statistical tests are needed when the research question asks for evidence of a difference, change, association, relationship, prediction, or intervention effect.
The wording of the research question is often the first clue.
| Research Question Signal | What It Usually Means | Statistical Test May Be Needed |
|---|---|---|
| “Is there a difference…?” | You are comparing groups | Yes |
| “Did scores improve…?” | You are measuring change over time | Yes |
| “Is X associated with Y…?” | You are testing categorical association | Yes |
| “Is X related to Y…?” | You are testing a relationship between variables | Yes |
| “Does X predict Y…?” | You are testing prediction | Yes |
| “What factors influence…?” | You may need regression or another model | Usually yes |
| “What percentage…?” | You are describing the sample or outcome | Usually no |
| “What is the mean…?” | You are summarizing a variable | Usually no |
For example, “What percentage of participants completed discharge education?” is descriptive. “Is discharge education completion associated with readmission status?” requires a statistical test because it asks whether two categorical variables are associated.
Similarly, “What was the average knowledge score?” is descriptive. “Did knowledge scores improve after discharge education?” requires a statistical test because it asks whether scores changed.
The safest rule is this: use descriptive statistics to describe; use statistical tests to test.
Use Statistical Tests When Comparing Groups
Nursing students use statistical tests when they need to compare outcomes between groups.
For example, a student may compare pain scores between an intervention group and a control group, patient satisfaction scores between two units, knowledge scores across three education levels, or burnout scores among nurses working different shift categories.
The first decision is whether the groups are independent and how many groups are being compared. Two different patient groups are independent. The same participants measured twice are paired. The same participants measured three or more times are repeated measures.
If two different groups are compared on a continuous outcome, an independent samples t-test may be suitable when assumptions are reasonable. If the outcome is ordinal, skewed, or not suitable for a t-test, the Mann-Whitney U test may be considered. If three or more independent groups are compared on a continuous outcome, one-way ANOVA may be suitable. If the outcome is ordinal or non-normal, the Kruskal-Wallis test may be more appropriate.
For example, comparing pain scores between patients in two different education groups may call for an independent samples t-test. Comparing satisfaction ratings across three outpatient clinics may call for ANOVA or Kruskal-Wallis, depending on measurement level and assumptions.
Statistical test selection should be based on the research objective and the nature of the data (Nayak & Hazra, 2011).
Need help before running the wrong test? If you are unsure whether your groups are independent, paired, or repeated, Nursing Dissertation Help can review your research questions, variables, and SPSS analysis plan before Chapter 4 becomes stressful.
Use Statistical Tests When Measuring Change Over Time
Statistical tests are often needed in pre-test/post-test and repeated-measures nursing studies.
These designs are common in nursing education, capstone projects, DNP projects, evidence-based practice projects, and quality improvement evaluations. Examples include knowledge before and after patient education, anxiety before and after a nursing intervention, medication adherence before and after counseling, hand hygiene compliance before and after training, and fall-risk score before and after protocol implementation.
If the same participants are measured before and after an intervention, the observations are usually paired. This matters because paired data should not be analyzed as if they came from two unrelated groups.
A paired samples t-test may be suitable when the outcome is continuous and assumptions are reasonable. The Wilcoxon signed-rank test may be considered when the outcome is ordinal or not suitable for a paired t-test. Repeated measures ANOVA may be used when the same participants are measured at three or more time points and assumptions are reasonable. The Friedman test may be considered for three or more repeated ordinal or non-normal measurements. McNemar’s test may be used when the same participants have paired yes/no outcomes.
For example, if the same patients complete a knowledge test before and after discharge education, a paired test is usually needed. If the same patients are classified as adherent or nonadherent before and after teaching, McNemar’s test may be more appropriate than a t-test.
A common student mistake is using an independent samples t-test for pre-test/post-test data. That is usually incorrect because the same participants produced both scores. The analysis should respect the paired structure of the data.
Use Statistical Tests When Testing Associations Between Categories
Association questions usually involve categorical variables.
Examples include readmission status and discharge education completion, infection status and unit type, medication adherence category and age group, fall occurrence and shift type, or pressure injury status and mobility category.
When both variables are categorical, the chi-square test of independence is often considered. Fisher’s exact test may be needed when the sample is small or expected cell counts are too low. Expected cell counts matter because a chi-square test relies on an approximation that may not perform well when cells are sparse. Kim explains that chi-square and Fisher’s exact tests are used to assess independence between categorical variables, with Fisher’s exact test often used when expected counts are small (Kim, 2017).
McNemar’s test is different. It is used for paired categorical data, such as yes/no outcomes measured before and after an intervention in the same participants.
For example, if a student examines whether readmission status differs by discharge education completion, chi-square or Fisher’s exact test may be appropriate. If the student examines whether the same nurses were compliant or noncompliant with hand hygiene before and after training, McNemar’s test may be more suitable.
Use Statistical Tests When Examining Relationships Between Scores
Relationship questions ask whether two variables move together.
Examples include nurse burnout and job satisfaction, self-efficacy and medication adherence score, age and systolic blood pressure, stress and sleep quality, or pain score and patient satisfaction.
Pearson correlation may be used when both variables are continuous, the relationship is approximately linear, and outliers do not distort the result. Spearman correlation may be used when variables are ordinal, ranked, skewed, or related in a monotonic but not clearly linear way.
For example, a student studying nurse burnout and job satisfaction may use Pearson correlation if both variables are continuous scale scores and assumptions are reasonable. If the variables are ordinal ratings or strongly skewed, Spearman correlation may be more suitable.
Correlation does not prove causation. A relationship between burnout and job satisfaction does not prove that burnout caused lower job satisfaction. Study design, timing, confounding variables, and measurement quality matter.
Use Statistical Tests When Predicting Nursing or Patient Outcomes
Prediction questions ask whether one or more variables estimate an outcome.
Examples include whether comorbidity score predicts readmission, nurse staffing predicts fall rates, age, BMI, and adherence predict blood pressure control, health literacy predicts medication adherence score, or burnout and workload predict intention to leave.
Prediction questions usually require regression or another model. Simple linear regression may be used when one predictor is used to predict a continuous outcome. Multiple linear regression may be used when several predictors are used to predict a continuous outcome. Binary logistic regression may be used when the outcome is yes/no, such as readmitted/not readmitted or controlled/uncontrolled blood pressure. Ordinal logistic regression may be considered when the outcome has ordered categories, such as low, moderate, or high satisfaction.
Prediction tests require careful attention to outcome type, predictor coding, sample size, missing data, assumptions, multicollinearity, model fit, and interpretation. Regression is powerful, but it can also be misused when students do not have a clear outcome variable, enough data, or a justified analysis plan.
Students working with prediction questions can review predictive data analysis in healthcare research.
When Not to Use a Statistical Test
This is one of the most important parts of statistical decision-making. A statistical test is not always necessary, and sometimes it is not appropriate.
Do Not Use a Statistical Test for Purely Descriptive Questions
If the research question only asks what the sample looks like, descriptive statistics are enough.
For example, “What percentage of nurses completed the survey?” can be answered with a percentage. “What was the mean age of participants?” can be answered with a mean and standard deviation. “How many patients were readmitted?” can be answered with a frequency and percentage.
These questions do not ask whether variables differ, change, relate, associate, or predict. Adding p-values to every descriptive table can make Chapter 4 look unfocused and may confuse readers.
Do Not Test Without a Research Question or Hypothesis
A statistical test should answer an approved research question or hypothesis. Running tests simply because SPSS makes them available is poor analysis planning.
For example, a dataset may contain age, gender category, education level, unit type, years of experience, satisfaction scores, burnout scores, and shift category. That does not mean every variable should be tested against every other variable. Each test should have a purpose.
Unplanned testing increases the risk of finding statistically significant results by chance. Students should avoid running many exploratory tests unless the project clearly justifies that approach.
Do Not Use a Test That Does Not Match the Variable Type
A t-test is not appropriate for a yes/no outcome. Chi-square is not appropriate for comparing mean pain scores. Correlation is not appropriate for testing paired pre/post categorical change.
Before selecting a test, identify the dependent variable and independent, grouping, or predictor variable. The test must match the measurement level of the outcome and the structure of the data.
Do Not Ignore Paired or Repeated Data
Pre-test/post-test data from the same participants are usually paired. Measurements across baseline, post-test, and follow-up are repeated. These designs require tests that account for related observations.
Treating paired data as independent can produce incorrect results because it ignores the connection between repeated measurements from the same person.
Do Not Use Inferential Tests When Data Quality Is Too Poor
If data are incomplete, miscoded, inconsistent, or full of unhandled missing values, running a statistical test may produce misleading results.
Before inferential analysis, students should check whether missing values are clearly coded, impossible values have been removed or corrected, group labels are consistent, scale scores are calculated correctly, reverse-coded items have been handled correctly, outliers have been reviewed, and SPSS measurement levels are assigned appropriately.
A clean dataset is not optional. Poor coding can make even the correct statistical test produce wrong results.
Do Not Force a Parametric Test When Assumptions Are Seriously Violated
Parametric tests such as t-tests, ANOVA, Pearson correlation, and linear regression have assumptions. These may include normality, independence, equal variances, linearity, absence of extreme outliers, and appropriate residual patterns depending on the test.
A slight assumption issue does not always invalidate a test, but serious violations should not be ignored. Students may need a nonparametric alternative, data transformation, a different model, or expert review.
Do Not Use p-Values to Decorate Chapter 4
A p-value should not be added simply to make a table look more advanced. Statistical tests should answer research questions. Unnecessary p-values can distract from the purpose of the study and make Chapter 4 harder to defend.
A strong Chapter 4 is not the chapter with the most p-values. It is the chapter where every analysis clearly answers an approved research question.
How Research Questions Help Decide When to Use Statistical Tests
Research questions are the strongest guide for deciding whether a statistical test is needed. Each question should be classified before analysis begins.
| Nursing Research Question | Type of Question | Is a Statistical Test Needed? | Possible Test Family |
|---|---|---|---|
| What are the demographic characteristics of participants? | Descriptive | Usually no | Frequencies, percentages, means, SDs |
| What percentage of participants had controlled blood pressure? | Descriptive | Usually no | Frequency and percentage |
| Did knowledge scores improve after education? | Change over time | Yes | Paired t-test or Wilcoxon signed-rank test |
| Is medication adherence associated with age group? | Association | Yes | Chi-square or Fisher’s exact test |
| Are satisfaction scores different across three wards? | Group difference | Yes | ANOVA or Kruskal-Wallis |
| Is burnout related to job satisfaction? | Relationship | Yes | Pearson or Spearman correlation |
| Does comorbidity predict readmission? | Prediction | Yes | Logistic regression |
| Do age and BMI predict systolic blood pressure? | Prediction | Yes | Linear regression |
This table shows why some questions require only descriptive statistics while others require inferential tests. A demographic table does not need a p-value unless the research question specifically asks for group comparison. A hypothesis about improvement, association, relationship, or prediction usually requires a statistical test.
A useful approach is to label every research question before analysis as descriptive, difference-based, change-over-time, association-based, relationship-based, prediction-based, or intervention-effect-based. Once the question type is clear, the test family becomes easier to identify. The specific test then depends on variable type, number of groups, paired versus independent data, assumptions, and sample size.
How Variable Type Affects When to Use Statistical Tests
Test selection depends heavily on the type of variables involved.
The dependent variable is the outcome being measured or predicted. In nursing research, examples include pain score, knowledge score, anxiety score, adherence score, readmission status, fall occurrence, satisfaction score, pressure injury status, and blood pressure control.
The independent variable is the variable used to explain, compare, or predict the outcome. Examples include intervention group, education level, age group, unit type, staffing level, health literacy, and comorbidity score.
A grouping variable divides participants into categories for comparison. Examples include intervention vs control group, day shift vs night shift, three wards, or low/moderate/high adherence group.
Continuous variables include age, blood pressure, length of stay, pain score, knowledge score, satisfaction total score, and burnout scale score. These may be analyzed using t-tests, ANOVA, correlation, or linear regression when assumptions support those choices.
Categorical variables include unit type, education category, adherence category, infection status, and mobility category. These may require chi-square, Fisher’s exact test, or logistic regression depending on the research question.
Binary variables have two categories, such as readmitted/not readmitted, fall/no fall, controlled/uncontrolled blood pressure, or adherent/nonadherent. Binary outcomes often require chi-square, McNemar’s test, or logistic regression depending on whether the data are independent, paired, or predictive.
Ordinal variables have ordered categories, such as pain severity level, satisfaction rating, confidence rating, or a single Likert item. These variables require careful handling because the categories have order but may not have equal spacing.
Likert-scale data are especially important in nursing research. A single Likert item, such as “I am satisfied with care” rated from 1 to 5, is usually ordinal. A summed or averaged multi-item scale score may sometimes be treated as approximately continuous if the scale is reliable, distribution is reasonable, sample size is adequate, and the analysis plan supports that decision. Sullivan and Artino explain that Likert-type data are often misunderstood when researchers ignore the difference between individual ordinal items and scale scores (Sullivan & Artino, 2013).
Students should not choose a test before identifying the dependent variable and independent, predictor, or grouping variable. Many wrong-test decisions begin with unclear variables.
How Study Design Affects When to Use Statistical Tests
Study design affects whether a statistical test is needed and which type applies.
In a cross-sectional study, variables are measured at one point in time. A student may use descriptive statistics to summarize the sample, correlation to examine relationships, chi-square to test categorical association, or regression to test prediction.
In a pre-test/post-test study, the same participants are often measured before and after an intervention. A paired test is usually needed if the research question asks whether scores changed.
In a quasi-experimental study, groups may be compared without random assignment. A student may compare outcomes between intervention and comparison groups, but interpretation should be cautious because group differences may be influenced by baseline differences.
In an experimental study, participants may be assigned to groups. Statistical tests may compare outcomes across groups or time points, depending on the design and hypotheses.
In a retrospective chart review, existing clinical records are analyzed. Statistical tests may examine associations, compare groups, or predict outcomes, but coding quality, missing data, and documentation consistency must be checked carefully.
In a quality improvement project, descriptive statistics may be enough for monitoring trends, but statistical tests may be used when the project formally evaluates change before and after an intervention.
In an evidence-based practice project, statistical tests may be used when the project collects quantitative outcome data and asks whether an intervention is associated with change.
In a correlational study, tests such as Pearson or Spearman correlation may examine relationships between variables.
In a predictive study, regression models may estimate outcomes from one or more predictors.
The main design distinction is whether the data are independent, paired, repeated, categorical, correlational, or predictive. This design feature often determines the test family before the specific test is chosen.
When to Use Parametric vs Nonparametric Tests
Students may need nonparametric tests when assumptions for parametric tests are not reasonable.
Parametric tests are often used when the outcome is continuous and assumptions such as normality, independence, and similar variance are reasonable. Nonparametric tests are often used when the outcome is ordinal, skewed, affected by outliers, based on ranks, or unsuitable for a parametric test.
| Situation | Parametric Option | Nonparametric Option |
|---|---|---|
| Two independent groups | Independent samples t-test | Mann-Whitney U test |
| Two paired measurements | Paired samples t-test | Wilcoxon signed-rank test |
| Three or more independent groups | One-way ANOVA | Kruskal-Wallis test |
| Three or more repeated measurements | Repeated measures ANOVA | Friedman test |
| Relationship between two variables | Pearson correlation | Spearman correlation |
Nonparametric tests are not weak or unacceptable. They may be more appropriate when the data structure or assumptions support them. For example, ordinal pain ratings, skewed satisfaction scores, or small samples with outliers may be better analyzed using a nonparametric approach. Nonparametric tests are useful when continuous data do not meet assumptions for parametric tests (Nahm, 2016).
The decision should not be, “Which test sounds more advanced?” The better question is, “Which test fits the research question, variable type, data structure, distribution, and assumptions?”
When to Use Statistical Tests in SPSS
SPSS is a tool for running statistical tests. It is not a substitute for correct test selection.
Students should decide the test before clicking SPSS menus. SPSS can produce output even when the selected test does not match the research question, variable type, design, or assumptions.
IBM SPSS Statistics Base includes procedures for common tests such as t-tests, ANOVA, correlations, regression, crosstabs, and nonparametric analysis (IBM Corp., 2024). However, menu wording may vary slightly by SPSS version, so students should follow their software version and institutional guidance.
Before running tests in SPSS, nursing students should follow a short workflow.
First, match each research question to an analysis purpose. Decide whether the question is descriptive, comparative, change-based, associative, relational, or predictive.
Second, identify the dependent variable and the independent, grouping, or predictor variable. Ask what outcome is being analyzed and what variable explains, groups, compares, or predicts it.
Third, check variable coding, value labels, missing values, and measurement levels. Group codes should be consistent, missing values should be defined correctly, and variables should be marked as nominal, ordinal, or scale as appropriate.
Fourth, run descriptive statistics before inferential tests. Frequencies, means, medians, charts, and ranges can reveal outliers, coding errors, impossible values, and unexpected distributions.
Fifth, check assumptions. Depending on the test, this may include normality, outliers, variance equality, expected cell counts, linearity, residual patterns, and multicollinearity.
Finally, run only the statistical test that matches the research question and interpret the output in relation to that question. A p-value alone is not enough.
This workflow helps prevent a common Chapter 4 problem: having SPSS output that looks statistical but does not actually match the approved research question.
When Statistical Test Results Belong in Chapter 4
Statistical test results belong in Chapter 4 when they answer a research question or hypothesis.
A strong Chapter 4 usually separates descriptive and inferential results. The demographic table describes the sample. Descriptive statistics tables summarize variables. Inferential test tables answer research questions. Regression tables report predictors and model results. A summary of findings may organize results by research question.
For example, Chapter 4 may include a demographic characteristics table, a descriptive statistics table for main study variables, a pre-test/post-test comparison table, a chi-square or Fisher’s exact test table for categorical association, a correlation table for relationship questions, a regression table for prediction questions, and a short paragraph interpreting each research question.
SPSS output should not be pasted into Chapter 4 without interpretation. Students should convert output into clean APA 7 results tables and paragraphs. Results should include the test statistic, degrees of freedom where relevant, p-value, confidence interval or effect size when appropriate, and a plain-language interpretation.
APA guidance recommends reporting exact p-values when possible and using p < .001 rather than p = .000 for very small values (American Psychological Association, 2024). Students should also connect results to the research question rather than reporting disconnected p-values.
When Statistical Significance Is Not Enough
Nursing students should not stop at “p < .05.”
A p-value does not show the size of the effect, clinical importance, or practical meaning. The American Statistical Association cautions that p-values should not be treated as simple proof of a finding (Wasserstein & Lazar, 2016). Students should interpret p-values alongside effect size, confidence intervals, direction of effect, sample size, assumptions, and clinical relevance.
For example, a pain-score difference may be statistically significant but too small to matter in practice. A weak correlation may be statistically significant in a large sample but may not support a strong practice recommendation. A non-significant result may still be useful if it identifies feasibility issues, measurement problems, sample size limitations, or areas for future research.
Davis et al. emphasize that research reports should address effect sizes, confidence intervals, and clinical relevance rather than focusing only on statistical significance (Davis et al., 2021).
For nursing students, this means Chapter 4 should report the result accurately, while Chapter 5 should discuss what the result means for patient care, nursing education, quality improvement, leadership, policy, limitations, and future research.
Common Mistakes Nursing Students Make About When to Use Statistical Tests
Nursing students often make analysis mistakes because they misunderstand when statistical tests are needed.
A common mistake is using a test for every table. A demographic table usually does not need a p-value unless the study is comparing demographic differences between groups.
Another mistake is reporting only descriptive statistics when the research question requires inference. If a research question asks whether knowledge scores improved, reporting only pre-test and post-test means is incomplete.
Students also choose tests based on classmates’ projects, run multiple tests without a plan, ignore whether data are paired or independent, confuse association with correlation, use regression when correlation is enough, or use correlation when prediction is required.
Likert-scale mistakes are also common. A single Likert item should not automatically be treated the same as a summed scale score. Normality, sample size, reliability, and the approved analysis plan matter.
Another common mistake is using p-values as the only evidence. A strong nursing interpretation should explain the direction of the result, size of the effect, clinical or educational meaning, and limitations.
Finally, many students copy SPSS output without APA interpretation. Chapter 4 should explain the result, not simply display software tables.
When to Ask for Help Choosing Statistical Tests
Students should ask for help when they are unsure whether their research question requires a statistical test, cannot identify dependent and independent variables, are unsure whether groups are independent or paired, have a small sample size, have Likert-scale data, have missing or messy data, or need to justify the test to a committee.
Help is also useful when SPSS output does not match the proposal, Chapter 4 tables need APA 7 formatting, or the student is unsure how to explain statistical and clinical significance.
Nursing Dissertation Help can support students with statistical test selection, SPSS data analysis, nursing dissertation data analysis, capstone data analysis, evidence-based practice project data analysis, Chapter 4 results writing, APA 7 results reporting, and quantitative methodology alignment. Students who already have a dataset, SPSS output, or supervisor feedback can also review dissertation data analysis help.
Editor’s note: This guide is intended to help nursing students decide when statistical tests may be needed in academic research. Final test selection should follow the approved research question, study design, variable measurement level, assumptions, sample size, analysis plan, and institutional or committee requirements.
FAQs About When to Use Statistical Tests
1. When should I use statistical tests in nursing research?
Use statistical tests when your research question asks about a difference, change, association, relationship, prediction, intervention effect, or hypothesis. For example, if you want to know whether knowledge scores improved after education or whether readmission is associated with discharge teaching, a statistical test is usually needed.
2. When are descriptive statistics enough?
Descriptive statistics are enough when the goal is only to summarize the sample or describe variables. Examples include reporting age, gender category, mean satisfaction score, percentage readmitted, or baseline clinical characteristics. Descriptive statistics answer “what does the sample look like?”
3. Do I need a statistical test for every research question?
No. Some research questions are descriptive and do not need inferential testing. A demographic question may only need frequencies and percentages. A question about whether scores improved, groups differed, or variables were related usually needs a statistical test.
4. When should I use a t-test?
Use a t-test when comparing two means. An independent samples t-test compares two unrelated groups, such as intervention and control groups. A paired samples t-test compares two related measurements, such as pre-test and post-test scores from the same participants.
5. When should I use chi-square?
Use chi-square when testing whether two categorical variables are associated. For example, you may use chi-square to examine whether readmission status is associated with discharge education completion. If expected cell counts are too small, Fisher’s exact test may be more appropriate.
6. When should I use ANOVA?
Use ANOVA when comparing mean scores across three or more groups or time points. One-way ANOVA compares three or more independent groups. Repeated measures ANOVA compares three or more related measurements from the same participants.
7. When should I use correlation?
Use correlation when the research question asks whether two variables are related. Pearson correlation is usually used for continuous variables with a linear relationship. Spearman correlation is often used for ordinal, ranked, skewed, or non-normal variables. Correlation does not prove causation.
8. When should I use regression?
Use regression when the research question asks whether one or more variables predict an outcome. Linear regression is used for continuous outcomes. Binary logistic regression is used for yes/no outcomes. Ordinal logistic regression may be used for ordered categorical outcomes.
9. When should I use nonparametric tests?
Use nonparametric tests when the data are ordinal, skewed, affected by outliers, based on ranks, or do not meet assumptions for parametric tests. Examples include Mann-Whitney U, Wilcoxon signed-rank, Kruskal-Wallis, Friedman, and Spearman correlation.
10. Do pre-test and post-test studies need statistical tests?
Often, yes. If the research question asks whether scores changed from pre-test to post-test, a statistical test is usually needed. Because the same participants are usually measured twice, paired tests such as paired samples t-test, Wilcoxon signed-rank test, or McNemar’s test may be appropriate depending on the outcome type.
11. Can SPSS tell me when to use a statistical test?
No. SPSS can run statistical tests, but it cannot fully decide whether a test matches your research question, variables, study design, assumptions, and methodology. Students must choose the test before interpreting SPSS output.
12. When should I ask for help choosing statistical tests?
Ask for help when you cannot tell whether your question needs descriptive or inferential analysis, cannot identify your dependent and independent variables, have paired or repeated data, have Likert-scale data, have a small sample, have messy data, or need Chapter 4 APA 7 interpretation.
Conclusion
Knowing when to use statistical tests is essential for nursing students writing dissertations, capstone projects, evidence-based practice reports, quality improvement projects, and quantitative research assignments.
Use statistical tests when your research questions examine differences, change, associations, relationships, prediction, or intervention effects. Use descriptive statistics when your purpose is only to summarize the sample, describe baseline characteristics, or report frequencies, percentages, means, medians, and standard deviations.
Not every table needs a p-value, and not every research question requires inferential analysis. Correct test selection depends on the research question, variable type, study design, assumptions, sample size, SPSS output, and APA 7 reporting expectations.
If you are unsure when to use statistical tests, how to choose the right test, how to interpret SPSS output, or how to write Chapter 4 results, request expert help from Nursing Dissertation Help. Getting support early can help you avoid preventable analysis errors, reduce Chapter 4 confusion, and present results that match your approved nursing research project.
References
American Psychological Association. (2024). Number and statistics guide. https://apastyle.apa.org/instructional-aids/numbers-statistics-guide.pdf
Davis, S. L., Johnson, A. H., Lynch, T., Gray, L., Pryor, E. R., Azuero, A., Soistmann, H. C., Phillips, S. R., & Rice, M. (2021). Inclusion of effect size measures and clinical relevance in research papers. Nursing Research, 70(3), 222–230. https://doi.org/10.1097/NNR.0000000000000494
IBM Corp. (2024). IBM SPSS Statistics Base 30. https://www.ibm.com/docs/SSLVMB_30.0.0/pdf/IBM_SPSS_Statistics_Base.pdf
Kim, H.-Y. (2017). Statistical notes for clinical researchers: Chi-squared test and Fisher’s exact test. Restorative Dentistry & Endodontics, 42(2), 152–155. https://doi.org/10.5395/rde.2017.42.2.152
Nahm, F. S. (2016). Nonparametric statistical tests for the continuous data: The basic concept and the practical use. Korean Journal of Anesthesiology, 69(1), 8–14. https://doi.org/10.4097/kjae.2016.69.1.8
Nayak, B. K., & Hazra, A. (2011). How to choose the right statistical test? Indian Journal of Ophthalmology, 59(2), 85–86. https://doi.org/10.4103/0301-4738.77005
Ranganathan, P. (2021). An introduction to statistics: Choosing the correct statistical test. Indian Journal of Critical Care Medicine, 25(Suppl 2), S184–S186. https://doi.org/10.5005/jp-journals-10071-23815
Sullivan, G. M., & Artino, A. R., Jr. (2013). Analyzing and interpreting data from Likert-type scales. Journal of Graduate Medical Education, 5(4), 541–542. https://doi.org/10.4300/JGME-5-4-18
Wasserstein, R. L., & Lazar, N. A. (2016). The ASA statement on p-values: Context, process, and purpose. The American Statistician, 70(2), 129–133. https://doi.org/10.1080/00031305.2016.1154108
