

Introduction
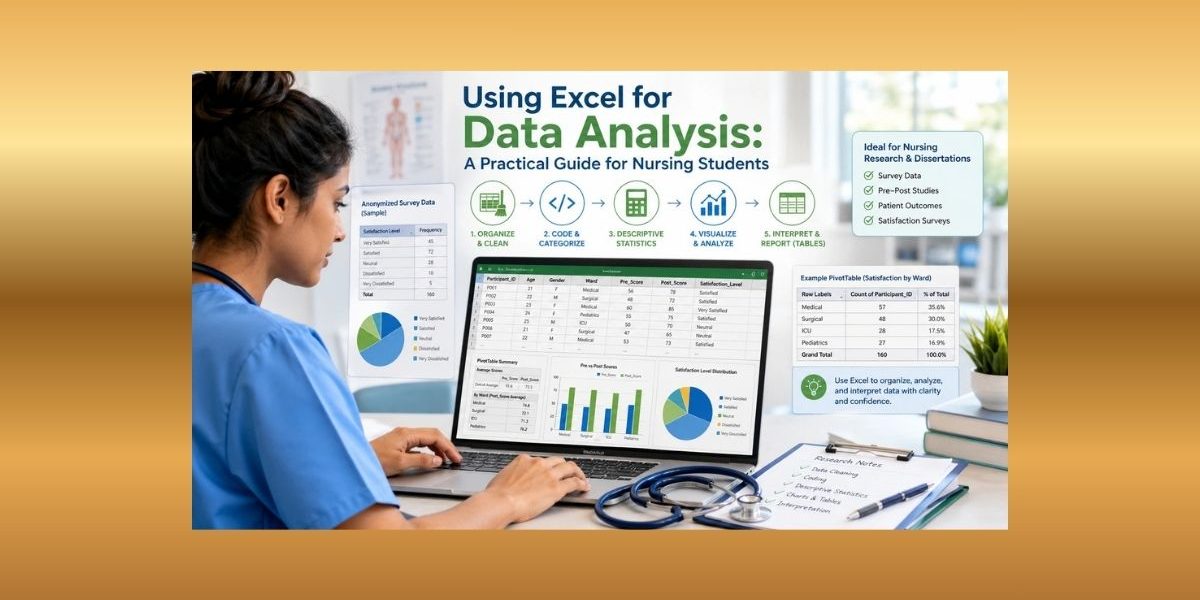
Using Excel for data analysis is one of the most practical skills nursing students can learn when working on assignments, clinical audits, evidence-based practice projects, research proposals, capstone projects, and dissertations. Many nursing students use Excel before they learn SPSS, R, Stata, Jamovi, or Python because it is familiar, accessible, and useful for organizing data in a clear table format.
Excel helps students manage survey responses, patient-related datasets, pre-test and post-test scores, clinical audit records, literature review matrices, and dissertation result tables. It can also be used to calculate descriptive statistics, create graphs, summarize questionnaire responses, and prepare clean tables for academic writing.
However, Excel must be used carefully. Nursing students need to understand data structure, coding, cleaning, confidentiality, formula accuracy, chart selection, and cautious interpretation. Excel can support good nursing research, but it should not replace sound research methods or statistical judgment.
What Does Using Excel for Data Analysis Mean in Nursing?
Using Excel for data analysis in nursing means entering, organizing, coding, cleaning, summarizing, visualizing, and interpreting data from nursing-related work. This may include academic assignments, undergraduate projects, postgraduate dissertations, clinical audits, patient education evaluations, and evidence-based practice activities.
For example, a nursing student may use Excel to analyze patient satisfaction survey responses after discharge education. Another student may summarize demographic data for a dissertation on medication adherence. A clinical audit project may use Excel to review hand hygiene compliance, wound care documentation, pressure injury prevention, or fall risk assessment records.
Excel can also support literature review organization. Students can build a literature matrix with columns for author, year, aim, sample, method, findings, limitations, and relevance to the research question.
In nursing education, Excel is useful because it connects raw data to practical questions: What does the data show? How many participants responded? What percentage agreed? Did knowledge scores improve? Which ward had the highest compliance rate?
Why Nursing Students Use Excel for Data Analysis
Nursing students use Excel because it is widely available, beginner-friendly, and suitable for small or medium datasets. It allows students to enter data, clean errors, apply formulas, create charts, and summarize findings without needing advanced programming skills.
Excel is especially useful for descriptive statistics, dissertation tables, survey summaries, clinical audit reports, and simple visualizations. Microsoft explains that PivotTables help users calculate, summarize, and analyze data to identify comparisons, patterns, and trends (Microsoft Support, n.d.-a). This makes PivotTables useful for nursing students analyzing survey responses, ward-level audit data, or participant demographics.
Excel is also helpful before moving to SPSS or Jamovi. It allows students to understand variables, identify missing values, check errors, and prepare a clean dataset for further statistical analysis.
Still, Excel has limits. It is not always the best choice for advanced regression, complex inferential statistics, large datasets, reproducible coding workflows, or qualitative thematic analysis. For complex dissertation analysis, students may need SPSS, R, Stata, Jamovi, or Python.
Types of Nursing Data You Can Analyze in Excel
Nursing students can use Excel to analyze several types of data.
Demographic data includes age, gender, ward, year of study, education level, job role, or years of clinical experience. This is common in dissertation participant tables.
Survey data includes questionnaire responses from nursing students, nurses, patients, caregivers, or healthcare workers.
Likert-scale data includes responses such as Strongly Disagree, Disagree, Neutral, Agree, and Strongly Agree. These are common in satisfaction, attitude, confidence, and perception surveys.
Clinical audit data may include hand hygiene compliance, wound care documentation, medication administration records, pressure injury prevention, falls, or catheter care.
Pre-test and post-test scores are used in health education studies, training evaluations, and nursing knowledge assessments.
Patient satisfaction data may include ratings of communication, discharge teaching, pain management, dignity, or responsiveness.
Literature review matrices help students organize research articles before writing a dissertation or evidence-based practice paper.
Excel can also summarize simple coded qualitative data, such as counting how many responses mention “staff shortage,” “communication,” or “patient education.” For deeper qualitative analysis, students should use formal qualitative coding methods.
Step 1: Organizing Nursing Data in Excel
Good data analysis begins with proper organization. In Excel, each row should represent one participant, patient record, article, questionnaire, audit entry, or observation. Each column should represent one variable.
Use clear variable names such as:
- Participant_ID
- Age
- Gender
- Ward
- Pre_Score
- Post_Score
- Satisfaction_Level
- Medication_Adherence
- Education_Group
Avoid merged cells, blank header rows, repeated headings inside the dataset, and mixed information in one column. Microsoft recommends clean source data with clear column headers when creating PivotTables (Microsoft Support, n.d.-a).
Nursing students should also protect confidentiality. Use participant IDs instead of patient names. Health data should not include unnecessary identifiers. HHS guidance explains that de-identification reduces the risk of identifying individuals in protected health information (U.S. Department of Health & Human Services, 2025).
Example of a Well-Structured Nursing Dataset
| Participant_ID | Age | Gender | Ward | Pre_Score | Post_Score | Satisfaction_Level |
|---|---|---|---|---|---|---|
| P001 | 22 | Female | Medical | 55 | 78 | Agree |
| P002 | 24 | Male | Surgical | 60 | 74 | Neutral |
| P003 | 21 | Female | Medical | 48 | 65 | Agree |
| P004 | 25 | Female | Pediatric | 70 | 82 | Strongly Agree |
Step 2: Coding Data for Nursing Research
Coding means giving responses consistent numbers or labels before analysis. This helps Excel summarize categories correctly.
For example, gender may be coded as 1 = Female and 2 = Male. Group may be coded as 1 = Intervention and 0 = Control. Yes/no responses may be coded as 1 = Yes and 0 = No.
Likert-scale coding may look like this:
| Code | Response |
|---|---|
| 1 | Strongly Disagree |
| 2 | Disagree |
| 3 | Neutral |
| 4 | Agree |
| 5 | Strongly Agree |
Coding is important for dissertation data analysis because it supports formulas, PivotTables, charts, descriptive statistics, and group comparisons. It also helps students avoid inconsistent labels such as “Female,” “female,” “F,” and “fem” appearing as different categories.
Every coded dataset should have a codebook. A codebook explains each variable, code, label, missing value, and scoring rule. This is especially important when interpreting questionnaire data, because the meaning of high and low scores depends on how the responses were coded.
Step 3: Cleaning Nursing Data in Excel
Data cleaning improves accuracy before analysis. It involves checking missing values, duplicate records, spelling inconsistencies, wrong formats, impossible values, and formula errors.
Common nursing data problems include:
- Duplicate questionnaire responses
- Missing age or post-test scores
- Ward names entered inconsistently
- Age recorded as 250
- Dates entered in different formats
- Gender entered using several labels
- Blank cells inside important variables
Useful Excel tools include Filter, Sort, Remove Duplicates, Conditional Formatting, TRIM, CLEAN, IF, ISBLANK, COUNTBLANK, and COUNTIF.
Examples:
=COUNTBLANK(E2:E100) checks missing values in a score column.
=TRIM(B2) removes unnecessary spaces from text.
=IF(ISBLANK(F2),"Missing","Complete") labels missing post-test scores.
Power Query can also help students import, clean, and transform data before analysis. Microsoft describes Power Query as a tool for connecting to data and shaping it for use in Excel (Microsoft Support, n.d.-b).
Step 4: Sorting and Filtering Nursing Data
Sorting and filtering help nursing students inspect their data before analysis.
Sorting arranges data in order. A student may sort participants by age, post-test score, ward, study group, or date of audit. This can help identify unusual scores, duplicate records, or missing values.
Filtering temporarily displays records that meet selected conditions. For example, a student may filter:
- Female respondents only
- Year 3 nursing students only
- Patients from the surgical ward
- Participants in the intervention group
- Missing questionnaire responses
- Patients with poor medication adherence
Filtering does not delete data unless the student chooses to delete visible rows. Hidden rows remain in the dataset.
Students should also be careful when calculating filtered data. Some formulas may still include hidden rows. If the student wants to calculate visible filtered records only, they should use tools such as SUBTOTAL or PivotTables.
Step 5: Using Excel Formulas for Nursing Data Analysis
Excel formulas help nursing students calculate accurate summaries without doing everything manually.
| Formula | Example | Nursing Student Use |
|---|---|---|
| SUM | =SUM(E2:E50) |
Total audit score |
| AVERAGE | =AVERAGE(E2:E50) |
Mean knowledge score |
| MEDIAN | =MEDIAN(E2:E50) |
Middle satisfaction score |
| MODE | =MODE.SNGL(E2:E50) |
Most common response |
| MIN | =MIN(E2:E50) |
Lowest pre-test score |
| MAX | =MAX(E2:E50) |
Highest post-test score |
| COUNT | =COUNT(E2:E50) |
Count numeric responses |
| COUNTA | =COUNTA(A2:A50) |
Count participant IDs |
| COUNTBLANK | =COUNTBLANK(E2:E50) |
Count missing scores |
| COUNTIF | =COUNTIF(G2:G100,"Agree") |
Count Agree responses |
| AVERAGEIF | =AVERAGEIF(D2:D100,"Medical",F2:F100) |
Mean score for Medical ward |
| IF | =IF(F2>E2,"Improved","Not Improved") |
Classify score improvement |
| XLOOKUP | =XLOOKUP(B2,Code!A:A,Code!B:B) |
Match codes to labels |
For percentages, students can divide a category count by the valid total:
=COUNTIF(G2:G100,"Agree")/COUNTA(G2:G100)*100
This formula calculates the percentage of respondents who selected “Agree.”
Step 6: Descriptive Statistics in Excel for Nursing Students
Descriptive statistics summarize what the data shows. They help nursing students describe participants, responses, scores, and clinical patterns.
Common descriptive statistics include frequency, percentage, mean, median, mode, minimum, maximum, range, and standard deviation.
Examples include:
- Mean age of participants
- Percentage of female respondents
- Frequency of nursing students by year of study
- Average knowledge score after patient education
- Standard deviation of patient satisfaction scores
- Range of medication adherence scores
Formula examples:
=AVERAGE(E2:E100) calculates the mean.
=STDEV.S(E2:E100) calculates the sample standard deviation.
=MAX(E2:E100)-MIN(E2:E100) calculates the range.
Excel’s Analysis ToolPak can also generate descriptive statistics. Microsoft explains that the Analysis ToolPak is an Excel add-in that provides data analysis tools (Microsoft Support, n.d.-c).
Descriptive statistics describe data. They do not prove cause and effect.
Step 7: Analyzing Survey and Likert-Scale Data in Excel
Nursing questionnaires often use Likert-scale responses to measure satisfaction, confidence, knowledge, perception, or attitude.
A simple Excel analysis may include frequencies and percentages for each response option.
| Response | Frequency | Percentage |
|---|---|---|
| Strongly Disagree | 4 | 4.0 |
| Disagree | 8 | 8.0 |
| Neutral | 18 | 18.0 |
| Agree | 50 | 50.0 |
| Strongly Agree | 20 | 20.0 |
Useful formulas include:
=COUNTIF(B2:B101,"Agree")
=COUNTIF(B2:B101,"Agree")/COUNTA(B2:B101)*100
Likert-scale data should be interpreted carefully. Sullivan and Artino explain that individual Likert-type items are ordinal because the response options have order, but equal distance between categories should not automatically be assumed (Sullivan & Artino, 2013).
For nursing dissertations, students should explain whether they are reporting individual Likert items as frequencies or combining several items into a scale score.
Step 8: Using PivotTables for Nursing Data Analysis
PivotTables help nursing students summarize data quickly. They can count, average, group, filter, and compare variables without writing many formulas.
A student can use PivotTables to summarize:
- Participants by gender
- Satisfaction scores by ward
- Medication adherence by age group
- Pre-test and post-test scores by group
- Clinical audit results by month
- Survey responses by category
A PivotTable has four main areas:
Rows: categories such as Ward, Gender, or Year of Study.
Columns: comparison groups such as Intervention and Control.
Values: counts, averages, sums, or percentages.
Filters: selected subgroups such as one ward or one year group.
Example: place Ward in Rows and Satisfaction_Score in Values, then set Values to Average. This shows the average satisfaction score for each ward.
PivotTables are useful for demographic tables, clinical audit summaries, questionnaire results, and basic Excel dashboards.
Step 9: Creating Charts and Graphs for Nursing Data
Charts help nursing students present findings clearly. Excel supports bar charts, column charts, pie charts, line charts, histograms, and scatter plots. Microsoft explains that charts help users visualize worksheet data and choose different chart types depending on the data being presented (Microsoft Support, n.d.-d).
Use bar charts for categories such as satisfaction levels. Use column charts for group comparisons such as pre-test and post-test scores. Use pie charts only for simple proportions with few categories. Use line charts for trends over time, such as monthly fall rates. Use histograms for score distributions. Use scatter plots for relationships between two numeric variables.
Avoid 3D charts, overcrowded visuals, missing titles, poor axis labels, and pie charts with too many categories. Public health visualization guidance emphasizes choosing a visual based on the dataset and the message being communicated (Centers for Disease Control and Prevention, n.d.).
A good nursing chart should not stand alone. It should be followed by a short interpretation.
Step 10: Creating Dissertation Tables in Excel
Excel is useful for preparing nursing dissertation tables before transferring them into Word. Students can create demographic tables, frequency tables, descriptive statistics tables, pre-test/post-test tables, survey response tables, and clinical audit summaries.
A good dissertation table should be clear, numbered, labeled, and explained in the text. Percentages should include the sample size used. For example, “68% of participants were female” is clearer when written as “68 participants out of 100 were female.”
Sample Participant Demographics Table
| Variable | Category | Frequency (n) | Percentage (%) |
|---|---|---|---|
| Gender | Female | 68 | 68.0 |
| Gender | Male | 32 | 32.0 |
| Year of Study | Year 2 | 40 | 40.0 |
| Year of Study | Year 3 | 35 | 35.0 |
| Year of Study | Year 4 | 25 | 25.0 |
Example interpretation:
Most participants were female. Year 2 students formed the largest group, followed by Year 3 and Year 4 students.
Step 11: Using Excel for Basic Statistical Analysis
Excel can perform some basic statistical analysis, including descriptive statistics, correlation, t-tests, ANOVA, simple regression, and forecasting. The Data Analysis ToolPak provides additional statistical procedures for Excel users (Microsoft Support, n.d.-e).
However, nursing students should not run tests blindly. Before choosing a test, they should understand the research question, variable type, sample size, distribution, assumptions, missing data, and interpretation.
For example, comparing pre-test and post-test scores may require more than calculating two means. The student may need to consider whether the same participants completed both tests, whether the data are approximately normally distributed, and whether a paired t-test or non-parametric alternative is more suitable.
Excel may be acceptable for coursework, basic audits, descriptive summaries, and simple exploratory analysis. For formal dissertation analysis, SPSS, R, Stata, Jamovi, or Python may be more appropriate.
Step 12: Worked Example: Nursing Student Survey Data Analysis in Excel
Research Scenario
A nursing student wants to analyze whether a patient education session improved medication adherence knowledge scores.
Dataset
| Participant_ID | Group | Pre_Score | Post_Score | Improvement |
|---|---|---|---|---|
| P001 | Intervention | 55 | 78 | 23 |
| P002 | Intervention | 60 | 74 | 14 |
| P003 | Intervention | 48 | 65 | 17 |
| P004 | Intervention | 70 | 82 | 12 |
| P005 | Intervention | 62 | 80 | 18 |
Excel Steps
First, enter one participant per row and one variable per column. Next, calculate improvement using:
=D2-C2
Then calculate the mean pre-test score:
=AVERAGE(C2:C6)
Calculate the mean post-test score:
=AVERAGE(D2:D6)
Calculate the mean improvement:
=AVERAGE(E2:E6)
Calculate percentage improvement:
=(AVERAGE(D2:D6)-AVERAGE(C2:C6))/AVERAGE(C2:C6)*100
Results
| Measure | Result |
|---|---|
| Mean pre-test score | 59.0 |
| Mean post-test score | 75.8 |
| Mean improvement | 16.8 |
| Percentage improvement | 28.5% |
Interpretation
The average knowledge score increased from 59.0 before the education session to 75.8 after the session. This suggests improvement in medication adherence knowledge. However, this descriptive finding alone does not prove that the education session caused the improvement unless the study design and statistical testing support that conclusion.
Step 13: Excel vs SPSS, R, Jamovi, Stata, and Python for Nursing Students
| Tool | Best For | Nursing Student Use |
|---|---|---|
| Excel | Organizing, cleaning, formulas, charts, PivotTables | Early-stage analysis and descriptive summaries |
| SPSS | Menu-based statistical testing | Nursing dissertation inferential analysis |
| R | Reproducible statistics and advanced graphs | Postgraduate or advanced research |
| Jamovi | Free menu-based statistical analysis | Beginner-friendly alternative to SPSS |
| Stata | Regression, epidemiology, structured analysis | Public health and clinical research |
| Python | Automation, large datasets, machine learning | Advanced healthcare analytics |
Excel is best for organizing data, cleaning responses, coding variables, descriptive statistics, simple charts, and dissertation tables. SPSS, R, Stata, Jamovi, or Python may be better for inferential statistics, regression, reproducibility, complex models, and larger datasets.
A practical workflow is to organize and clean the data in Excel, then move to SPSS or Jamovi for formal statistical testing when required.
Excel Data Analysis Tools for Nursing Students
| Excel Tool | What It Does | Nursing Student Example |
|---|---|---|
| Sort | Arranges data in order | Sort patients by age or score |
| Filter | Displays selected records | View only Year 3 nursing students |
| Remove Duplicates | Removes repeated records | Delete duplicate survey submissions |
| Conditional Formatting | Highlights values visually | Highlight missing scores or outliers |
| Formulas | Calculates summaries | Mean satisfaction score |
| COUNTIF | Counts values meeting criteria | Count respondents who agreed |
| AVERAGEIF | Calculates group means | Mean score for one ward |
| PivotTables | Summarizes grouped data | Satisfaction by ward |
| Charts | Presents findings visually | Bar chart of knowledge scores |
| Data Analysis ToolPak | Runs basic statistical procedures | Descriptive statistics or t-test |
| Power Query | Imports and transforms data | Clean audit data from several files |
Common Mistakes Nursing Students Make When Using Excel for Data Analysis
One common mistake is mixing raw data and analysis in one worksheet. This makes it difficult to know what was changed. Students should keep raw data unchanged and analyze a cleaned copy.
Another mistake is using patient names instead of anonymous participant IDs. Nursing students must protect confidentiality and remove unnecessary identifiers from clinical or research datasets.
Students also make errors by leaving missing values unexplained, using inconsistent category labels, copying formulas incorrectly, reporting percentages without sample sizes, and creating charts without interpretation.
Likert-scale errors are common too. Students may calculate means for individual Likert items without explaining whether the responses are ordinal or part of a combined scale. Sullivan and Artino warn that Likert-type items require careful interpretation because they are ordinal responses (Sullivan & Artino, 2013).
Students should also avoid overclaiming. An increase in post-test scores may suggest improvement, but it does not automatically prove causation.
Best Practices for Nursing Students Using Excel for Data Analysis
Keep the raw dataset unchanged. Create a cleaned copy for analysis. Use clear variable names, consistent coding, and a separate codebook.
Check missing values before calculating results. Validate formulas manually using a few sample rows. Use PivotTables for grouped summaries, but clean spelling and categories first.
Label every chart clearly. Include a title, axis labels, units, and a short interpretation. Avoid 3D charts and overcrowded graphs.
Protect confidentiality by using participant IDs instead of names. NIH guidance emphasizes responsible data management, sharing, and protection of research participant privacy (National Institutes of Health, 2025).
Document every cleaning decision. For example, state whether missing responses were excluded, coded separately, or treated as missing. This improves transparency and protects the credibility of the analysis.
Excel Data Analysis Checklist for Nursing Students
- Each row represents one participant, patient record, article, or observation.
- Each column represents one variable.
- Variable names are clear and consistent.
- Raw data is saved separately from cleaned data.
- Patient names and identifiers are removed or protected.
- A codebook explains all codes and missing values.
- Duplicate records have been checked.
- Missing values have been identified and documented.
- Categories have consistent spelling.
- Impossible values have been checked.
- Formulas have been validated.
- Frequencies and percentages include sample sizes.
- PivotTables are based on clean data.
- Charts have clear titles and axis labels.
- Findings are interpreted cautiously.
- A backup copy has been saved.
When Nursing Students Should Get Help with Excel Data Analysis
Nursing students should get help when the dataset is messy, formulas are producing errors, questionnaire coding is confusing, or dissertation results need accurate interpretation.
Professional support may be useful for dissertation data cleaning, Excel formulas, PivotTables, survey analysis, descriptive statistics, data visualization, questionnaire coding, research tables, clinical audit summaries, and moving from Excel to SPSS.
Students should also seek support when supervisors request Chapter 4 revisions, when missing data is unclear, when Likert-scale results are difficult to interpret, or when they are unsure whether descriptive statistics are enough.
Need help using Excel for nursing data analysis? Request Quote Now for professional support with data cleaning, descriptive statistics, PivotTables, charts, dissertation tables, and interpretation.
Helpful internal resources include nursing dissertation data analysis help, quantitative data analysis in nursing research, descriptive data analysis in nursing research, inferential data analysis in nursing research, nursing dissertation writing help, and SPSS data analysis help.
FAQs About Using Excel for Data Analysis in Nursing
1. Can nursing students use Excel for data analysis?
Yes. Nursing students can use Excel to organize data, clean responses, code variables, calculate descriptive statistics, create charts, summarize survey results, and prepare dissertation tables.
2. Is Excel enough for nursing dissertation data analysis?
Excel may be enough for descriptive analysis, simple charts, clinical audit summaries, and early-stage data preparation. However, dissertations involving hypothesis testing, regression, advanced comparisons, or complex statistics may require SPSS, R, Stata, Jamovi, or Python.
3. What type of nursing data can be analyzed in Excel?
Excel can analyze demographic data, survey responses, Likert-scale items, clinical audit records, pre-test and post-test scores, patient satisfaction data, medication adherence data, health education outcomes, and literature review matrices.
4. Can Excel analyze Likert-scale questionnaire data?
Yes. Excel can summarize Likert-scale responses using frequencies, percentages, charts, PivotTables, and cautiously interpreted mean scores. However, Likert-type items should be interpreted carefully because they are ordinal responses (Sullivan & Artino, 2013).
5. Can Excel calculate descriptive statistics?
Yes. Excel can calculate frequencies, percentages, mean, median, mode, minimum, maximum, range, and standard deviation. The Analysis ToolPak can also support additional statistical procedures (Microsoft Support, n.d.-c).
6. Can Excel be used instead of SPSS?
Excel can replace SPSS for simple descriptive summaries and basic charts, but SPSS is usually better for formal statistical testing, variable labels, assumption checks, and dissertation-level output.
7. What are the limitations of Excel for nursing research?
Excel is limited for advanced statistical modeling, reproducible workflows, large datasets, qualitative coding, complex regression, and high-stakes clinical decision-making. It also depends heavily on manual accuracy.
8. When should I get help with Excel data analysis?
Get help when you are unsure how to code questionnaire responses, clean data, calculate descriptive statistics, use PivotTables, create charts, interpret findings, prepare dissertation tables, or move from Excel to SPSS.
Conclusion
Excel is a practical and accessible tool for nursing students who need to organize, clean, summarize, visualize, and interpret data. It supports assignments, clinical audits, evidence-based practice projects, capstone studies, and dissertations.
Students can use Excel to code variables, calculate descriptive statistics, analyze survey responses, create charts, prepare dissertation tables, and review clinical audit findings. However, Excel should be used carefully. Clean data, correct coding, formula accuracy, confidentiality, suitable charts, and cautious interpretation are essential.
When the analysis becomes complex, students should not guess. They should confirm the correct method, seek support, and use the software that best fits the research question.
Need support with Excel data analysis for a nursing assignment, audit, or dissertation? Request Quote Now for help with data cleaning, formulas, PivotTables, charts, dissertation tables, and interpretation.
References
Centers for Disease Control and Prevention. (n.d.). Planning data visualizations. https://www.cdc.gov/wcms/4.0/cdc-wp/data-presentation/data-vizualization-planning.html
Microsoft Support. (n.d.-a). Create a PivotTable to analyze worksheet data. https://support.microsoft.com/en-us/office/create-a-pivottable-to-analyze-worksheet-data-a9a84538-bfe9-40a9-a8e9-f99134456576
Microsoft Support. (n.d.-b). About Power Query in Excel. https://support.microsoft.com/en-us/office/about-power-query-in-excel-7104fbee-9e62-4cb9-a02e-5bfb1a6c536a
Microsoft Support. (n.d.-c). Load the Analysis ToolPak in Excel. https://support.microsoft.com/en-us/office/load-the-analysis-toolpak-in-excel-6a63e598-cd6d-42e3-9317-6b40ba1a66b4
Microsoft Support. (n.d.-d). Create a chart from start to finish. https://support.microsoft.com/en-au/office/create-a-chart-from-start-to-finish-0baf399e-dd61-4e18-8a73-b3fd5d5680c2
Microsoft Support. (n.d.-e). Use the Analysis ToolPak to perform complex data analysis. https://support.microsoft.com/en-us/office/use-the-analysis-toolpak-to-perform-complex-data-analysis-6c67ccf0-f4a9-487c-8dec-bdb5a2cefab6
National Institutes of Health. (2025). Data management and sharing policy. https://grants.nih.gov/policy-and-compliance/policy-topics/sharing-policies/dms
Sullivan, G. M., & Artino, A. R., Jr. (2013). Analyzing and interpreting data from Likert-type scales. Journal of Graduate Medical Education, 5(4), 541–542. https://pmc.ncbi.nlm.nih.gov/articles/PMC3886444/
U.S. Department of Health & Human Services. (2025). Guidance regarding methods for de-identification of protected health information in accordance with the HIPAA Privacy Rule. https://www.hhs.gov/hipaa/for-professionals/special-topics/de-identification/index.html
