

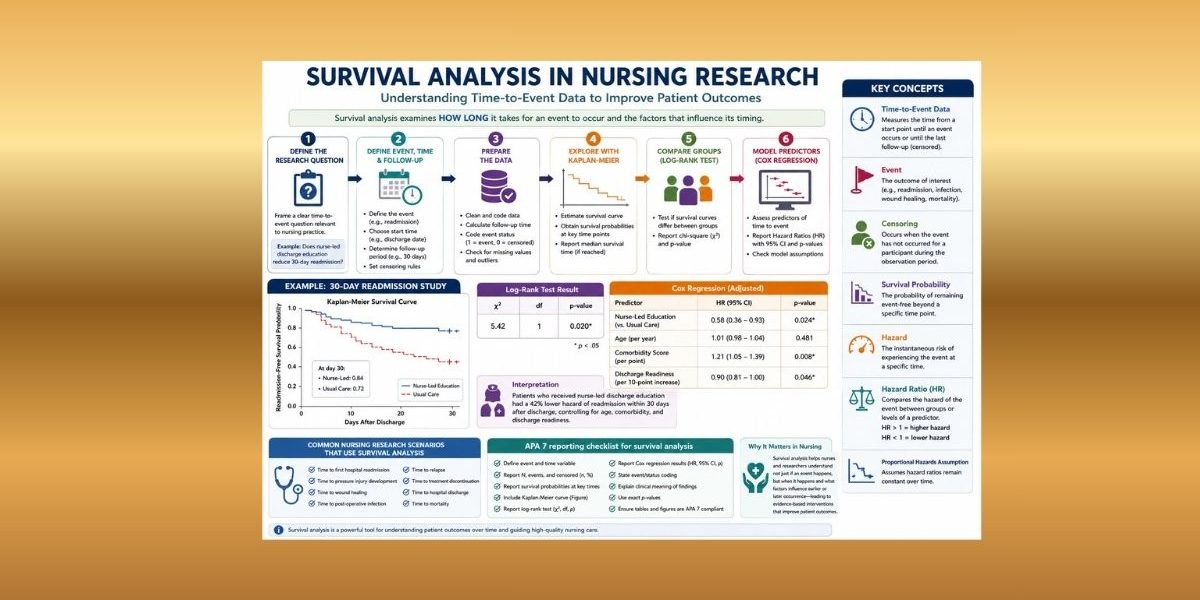
Many nursing students can explain a t-test, chi-square test, ANOVA, correlation, or regression model, but survival analysis becomes confusing because the research question changes. The issue is no longer only whether an event happened. The real question becomes how long it took for the event to happen.
That distinction matters in nursing and healthcare research.
A dissertation student may want to know how long it takes for patients to be readmitted after discharge. Another student may want to examine time to wound healing, time to pressure injury development, time to post-operative infection, time to relapse, time to treatment discontinuation, time to hospital discharge, or time to mortality. In these studies, two patients may both experience the same event, but one may experience it after 3 days and another after 90 days. A third patient may never experience the event before the study ends. A fourth patient may withdraw or transfer before the researcher can observe the outcome.
Ordinary statistical tests often fail in this situation because they may ignore follow-up time, censored observations, and differences in when events occur. Survival analysis, also called time-to-event analysis, is specifically designed to describe, compare, and predict the occurrence and timing of events in health-related research. Denfeld et al. (2023) describe survival analysis as a common approach for event data in cardiovascular nursing and broader health research, especially when researchers need to understand both event occurrence and event timing.
For nursing dissertation students, survival analysis in nursing research is useful when the dependent variable is time until a clearly defined event occurs. The method can support Chapter 3 methodology planning, Chapter 4 results reporting, Kaplan-Meier curves, log-rank tests, Cox proportional hazards regression, hazard ratio interpretation, and APA 7th edition reporting.
What Is Survival Analysis in Nursing Research?
Survival analysis is a family of statistical methods used when the outcome is the amount of time from a defined starting point until an event occurs. It is also called time-to-event analysis because the dependent variable combines two pieces of information: whether the event occurred and when it occurred.
In nursing and healthcare research, “survival” does not always mean death. The event can be any clinically meaningful outcome that happens over time. NIH/NCBI’s StatPearls survival analysis overview explains that survival analysis is commonly used in medical literature and includes methods such as Kaplan-Meier analysis, log-rank tests, and Cox proportional hazards models.
Examples of events in nursing research include:
| Nursing or healthcare event | Possible start time | Possible end point |
|---|---|---|
| Hospital readmission | Date of discharge | First unplanned readmission |
| Pressure injury development | Date of admission | First documented pressure injury |
| Wound healing | Date of wound assessment or treatment start | Complete wound closure |
| Post-operative infection | Date of surgery | First confirmed infection |
| Treatment discontinuation | Date medication or therapy begins | Date treatment stops |
| Relapse | Date of remission or treatment completion | Date relapse is confirmed |
| Hospital discharge | Date of admission | Date of discharge |
| Mortality | Date of diagnosis, admission, or intervention | Date of death |
| Treatment completion | Date intervention begins | Date treatment course is completed |
A survival analysis study must define the start time, event, follow-up period, and censoring rule before analysis begins. Without these definitions, Chapter 3 becomes weak and Chapter 4 results become difficult to defend.
For example:
In a readmission study, the start time may be the date of hospital discharge, the event may be first unplanned readmission, and the follow-up period may be 30 days after discharge.
In a wound healing study:
The start time may be the date of wound treatment initiation, the event may be complete wound closure, and the follow-up period may be 12 weeks.
Survival analysis is therefore not just another version of regression. It is a specialized approach for time-to-event outcomes.
Why Survival Analysis Matters in Healthcare and Nursing Studies
Survival analysis matters because many nursing outcomes unfold over time. A simple yes/no result may hide clinically important timing differences.
Consider this example:
- Patient A is readmitted 3 days after discharge.
- Patient B is readmitted 28 days after discharge.
- Patient C is not readmitted during the 30-day follow-up period.
- Patient D transfers to another healthcare system after 14 days with no documented readmission.
If a student only analyzes whether each patient was readmitted, Patient A and Patient B may be treated the same even though their clinical experiences differ. Patient C and Patient D may also be mishandled if the student does not understand censoring. Survival analysis solves this problem by using the available follow-up time for each participant.
Survival analysis helps nursing researchers:
- Estimate the probability of remaining event-free over time.
- Compare time-to-event patterns between patient groups.
- Account for censored participants.
- Identify predictors of earlier or later event occurrence.
- Examine whether an intervention delays or reduces event occurrence.
- Present findings using survival curves, hazard ratios, confidence intervals, and APA-style interpretation.
Denfeld et al. (2023) emphasize that survival analysis is useful because it considers both event occurrence and event timing, while common alternatives such as logistic regression cannot explain when events occur.
For students still deciding which statistical method fits their study, it is useful to review broader test-selection guidance in Statistical Tests in Nursing Research and When to Use Statistical Tests in Nursing Research.
Survival Analysis vs Ordinary Statistical Tests
Survival analysis differs from ordinary statistical tests because it focuses on time until an event, not only whether an event happened, whether group means differ, or whether variables are associated.
| Statistical method | Type of outcome | Main question answered | Why it may not replace survival analysis | Nursing example |
|---|---|---|---|---|
| Chi-square test | Categorical outcome | Are two categorical variables associated? | It compares event proportions but ignores event timing, censoring, and unequal follow-up. | Is 30-day readmission associated with discharge education group? |
| Independent samples t-test | Continuous outcome | Do two independent groups differ in mean score? | It compares means, not time until an event. | Do intervention and control groups differ in mean discharge readiness score? |
| Paired samples t-test | Continuous repeated outcome | Did the same participants change from pretest to posttest? | It tests mean change, not time-to-event patterns. | Did medication knowledge improve after education? |
| ANOVA | Continuous outcome across three or more groups | Do groups differ in mean outcome? | It compares means and does not handle censoring or event timing. | Do three hospital units differ in mean patient satisfaction? |
| Correlation | Two continuous or ordinal variables | Are two variables related? | It measures association but does not model time until an event. | Is age associated with length of stay? |
| Linear regression | Continuous outcome | What predicts a continuous outcome? | It is not designed for censored time-to-event outcomes. | What predicts anxiety score after discharge? |
| Logistic regression | Binary outcome | What predicts whether an event occurred? | It can answer whether the event occurred, but not when it occurred or how risk changes over time. | What predicts whether a patient was readmitted within 30 days? |
| Survival analysis | Time-to-event outcome | How long until the event occurs, and what predicts earlier or later event occurrence? | This is the correct family of methods when timing, censoring, and unequal follow-up matter. | Does nurse-led discharge education improve readmission-free survival? |
Logistic regression is useful when the outcome is binary and timing is not available. However, when a dataset includes follow-up time, event status, and censored observations, survival analysis is usually more appropriate. Columbia University’s public health guidance explains that time-to-event analysis is designed for outcomes where researchers need to account for both event occurrence and follow-up time.
For students comparing survival analysis with other regression methods, Regression Analysis Help and Predictive Data Analysis in Healthcare Research can support related decision-making.
Key Concepts in Survival Analysis
Survival analysis has its own vocabulary. Nursing students should understand these terms before writing Chapter 3 or interpreting Chapter 4.
Time-to-event data
Time-to-event data records the time from a defined starting point until an event occurs or until the participant is censored.
Example:
Number of days from hospital discharge to first unplanned readmission.
Event
The event is the outcome of interest. It must be clearly defined, measurable, and clinically meaningful.
Examples:
- First unplanned hospital readmission
- First documented pressure injury
- First confirmed post-operative infection
- Complete wound healing
- Treatment discontinuation
- Mortality
Denfeld et al. (2023) stress that identifying the event is a critical early step because the event definition determines how the dataset is coded and interpreted.
Survival time
Survival time is the amount of time from the start point to the event or censoring.
Example:
A patient discharged on March 1 and readmitted on March 12 has a survival time of 11 days if the event is readmission.
Start time
The start time is the baseline point from which follow-up begins.
Examples:
- Date of hospital discharge
- Date of surgery
- Date of diagnosis
- Date of admission
- Date of intervention
- Date of first wound assessment
End time
The end time is the date or time when the event occurs or when observation ends.
Examples:
- Date of readmission
- Date of infection
- Date of wound healing
- Date of death
- Date of final follow-up
- Date of withdrawal
Follow-up period
The follow-up period is the observation window during which participants are monitored.
Examples:
- 30 days after discharge
- 90 days after surgery
- 6 months after intervention
- 1 year after diagnosis
Censoring
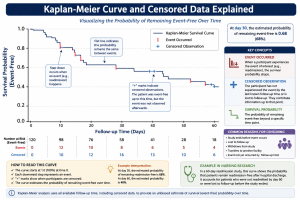
Censoring occurs when the exact event time is unknown because the event was not observed during the available follow-up. NIH/NCBI explains that censored subjects do not experience the outcome during the specified study timeframe, and excluding censored subjects can bias survival analysis results.
Right censoring
Right censoring is the most common type of censoring in dissertation-level nursing studies. It occurs when a participant has not experienced the event by the end of observation, or when the researcher no longer knows what happened after the last contact.
Example:
A patient is not readmitted during the 30-day follow-up period. The event may occur later, but it was not observed within the study window.
Survival probability
Survival probability is the probability of remaining event-free beyond a specific time point.
Example:
A 30-day readmission-free survival probability of 0.84 means that an estimated 84% of patients remained free from readmission through day 30.
Hazard
The hazard is the risk or rate of experiencing the event at a specific time among participants who have not yet experienced the event. NIH/NCBI distinguishes the survival function from the hazard rate: the survival function estimates the probability of not experiencing the event up to a time point, while the hazard rate reflects event occurrence within a period.
Hazard ratio
A hazard ratio compares the hazard between groups or predictor levels. A hazard ratio above 1 usually means a higher hazard of the event occurring sooner, while a hazard ratio below 1 usually means a lower hazard, depending on how the event is coded.
Example:
If the event is readmission and the adjusted hazard ratio for nurse-led discharge education is 0.60, the intervention group has a lower hazard of readmission than the comparison group.
Median survival time
Median survival time is the time at which the estimated survival probability reaches 0.50. If fewer than half of participants experience the event, the median survival time may not be reached.
Example:
Median time to readmission was not reached because fewer than 50% of participants were readmitted during follow-up.
Survival curve
A survival curve displays the estimated probability of remaining event-free over time. Kaplan-Meier curves are the most common survival curves used in nursing dissertation studies.
What Is Censored Data in Survival Analysis?
Censored data is one of the most important survival analysis concepts because it separates survival analysis from ordinary methods.
A censored participant provides partial information. The researcher knows the participant was event-free up to a certain time, but does not know the exact event time after that point.
Common nursing examples include:
- A patient has not been readmitted by the end of the study.
- A participant withdraws before relapse occurs.
- A patient transfers to another facility before infection status is confirmed.
- Follow-up ends before wound healing occurs.
- A patient is lost to follow-up.
- A patient remains alive at the end of a mortality study.
- A participant stops answering follow-up calls before treatment discontinuation is confirmed.
Censored cases should not be deleted automatically. They contain useful follow-up information up to the censoring time. IBM’s Cox regression documentation explains that censored subjects still contribute useful information to the estimation of a survival model.
A simple example shows why this matters:
| Patient | Follow-up result | Correct survival analysis interpretation |
|---|---|---|
| Patient A | Readmitted on day 8 | Event at 8 days |
| Patient B | Not readmitted by day 30 | Censored at 30 days |
| Patient C | Lost to follow-up on day 17 with no readmission | Censored at 17 days |
| Patient D | Readmitted on day 25 | Event at 25 days |
If Patient C is deleted, the analysis loses 17 days of valid readmission-free information. If Patient C is coded as “never readmitted,” the analysis falsely assumes long-term event-free status. Survival analysis handles this correctly by treating Patient C as censored at day 17.
Common Nursing Research Questions That Need Survival Analysis
Survival analysis is appropriate when the research question focuses on time until an event occurs.
Examples include:
- How long does it take for patients to be readmitted after discharge?
- Does nurse-led discharge education improve readmission-free survival?
- What factors predict time to pressure injury development?
- How long do patients remain medication-adherent after a nursing intervention?
- What predicts time to wound healing?
- Does nurse-led follow-up improve time to treatment completion?
- Which clinical factors predict time to relapse?
- How long does it take for patients to experience post-operative infection?
- What predicts time to hospital discharge?
- Does telehealth follow-up delay emergency department revisits?
- Does discharge readiness predict time to readmission?
- Does comorbidity burden predict earlier readmission?
- Does nurse staffing level predict time to hospital-acquired pressure injury?
- Does a transitional care intervention delay treatment discontinuation?
- Does patient education improve time to treatment completion?
These questions are stronger than simple event/no-event questions because they examine clinical timing, not only final status.
When Should Nursing Students Use Survival Analysis?
Nursing students should consider survival analysis when the study meets most of these conditions:
- The dependent variable is time until an event.
- The event is clearly defined.
- Follow-up time is recorded.
- Not all participants experience the event.
- Some observations are censored.
- Follow-up time differs across participants.
- The researcher wants to compare event-free time between groups.
- The researcher wants to identify predictors of time-to-event outcomes.
- The dataset includes start dates, event dates, last follow-up dates, or follow-up duration.
- The research question includes wording such as “time to,” “duration until,” “event-free survival,” “readmission-free survival,” “time until relapse,” or “predictors of earlier event occurrence.”
A student studying 30-day readmission may use survival analysis if the dataset includes discharge date, readmission date or censoring date, event status, and relevant group or predictor variables. A student with only a yes/no readmission variable and no timing information may need logistic regression instead.
When Survival Analysis Is Not Appropriate
Survival analysis is not suitable for every nursing dissertation.
It may not be appropriate when:
- There is no time-to-event outcome.
- The outcome is a continuous score, such as pain, anxiety, depression, knowledge, satisfaction, or quality of life.
- The outcome is binary but no timing information is available.
- Follow-up time is not recorded.
- The event is vague or inconsistently defined.
- The dataset has too few observed events.
- The event occurs for nearly everyone at the same time.
- The study design does not support time-to-event interpretation.
- The start time differs in unclear or clinically invalid ways.
- The event/status variable is unreliable.
For example, if a student measures medication knowledge before and after a teaching session, survival analysis is not appropriate because the outcome is a continuous score. A paired samples t-test, Wilcoxon signed-rank test, or repeated-measures method may be more appropriate.
If a student only knows whether patients were readmitted but does not know when they were readmitted or how long they were followed, survival analysis cannot be conducted properly. Logistic regression may be more appropriate in that case.
For broader planning, students may review Types of Data Analysis in Research and Inferential Data Analysis in Nursing Research.
Main Types of Survival Analysis
The main survival analysis methods used in nursing and healthcare dissertations include:
- Kaplan-Meier survival analysis
- Log-rank test
- Cox proportional hazards regression
- Life table analysis
NIH/NCBI identifies Kaplan-Meier methods, log-rank tests, Cox proportional hazards models, and life tables as common survival analysis approaches in healthcare research.
This article provides a broad guide. Dedicated supporting articles should cover Kaplan-Meier survival analysis, Cox regression, log-rank testing, hazard ratio interpretation, and SPSS survival analysis in more detail.
Kaplan-Meier Survival Analysis Explained
Kaplan-Meier survival analysis estimates the probability of remaining event-free over time. It is commonly used to create survival curves and summarize survival probabilities at different points during follow-up.
In a nursing readmission study, a Kaplan-Meier curve may show the probability of remaining readmission-free from day 0 to day 30 after discharge. In a wound healing study, it may show time until healing or, depending on coding, the probability of remaining unhealed over time.
IBM SPSS documentation explains that the Kaplan-Meier procedure estimates time-to-event models when censored cases are present and can produce survival tables, cumulative survival estimates, standard errors, cumulative events, number remaining, mean survival time, median survival time, and survival plots.
Kaplan-Meier analysis is useful when students need to:
- Estimate survival probability over time.
- Plot a survival curve.
- Show censored cases on a curve.
- Compare visual survival patterns between groups.
- Estimate median survival time when enough events occur.
- Report event-free probability at clinically meaningful time points.
However, Kaplan-Meier analysis does not adjust for multiple predictors. If the dissertation needs to examine whether age, comorbidity, disease severity, intervention group, and discharge readiness predict time to readmission, Cox regression may be needed.
Log-Rank Test Explained
The log-rank test compares survival curves between two or more groups. It is often used after Kaplan-Meier survival curves are generated.
Example nursing research question:
Does readmission-free survival differ between patients who received nurse-led discharge education and patients who received usual discharge instructions?
The Kaplan-Meier curve shows the survival pattern. The log-rank test evaluates whether the survival curves differ statistically.
NIH/NCBI explains that the log-rank test compares survival distributions between groups, but it does not estimate the size of the difference in the same way Cox regression does.
The log-rank test is useful when:
- The student has two or more groups.
- The outcome is time-to-event.
- The student wants to compare survival curves.
- The analysis does not require adjustment for multiple covariates.
The log-rank test is limited when:
- The student needs to control for predictors.
- Baseline group differences may confound results.
- The research question requires adjusted hazard ratios.
- The proportional hazards pattern is questionable.
Cox Proportional Hazards Regression Explained
Cox proportional hazards regression examines predictors of time-to-event outcomes. It is a survival regression method used when a student wants to estimate the relationship between one or more predictors and the hazard of an event.
Example nursing research question:
After controlling for age, comorbidity, and discharge readiness, does nurse-led discharge education predict time to 30-day hospital readmission?
Cox regression may include predictors such as:
- Age
- Comorbidity score
- Disease severity
- Intervention group
- Medication adherence
- Discharge readiness
- Health literacy
- Follow-up attendance
- Unit type
- Baseline clinical risk
- Nurse staffing level
IBM SPSS documentation describes Cox regression as a predictive model for time-to-event data and notes that the model uses observed subjects to estimate regression coefficients for predictors.
The main output from Cox regression is usually the hazard ratio. A hazard ratio above 1 usually indicates a higher hazard of the event occurring sooner. A hazard ratio below 1 usually indicates a lower hazard of the event occurring sooner, depending on event coding.
Example:
If the event is readmission and the adjusted hazard ratio for nurse-led discharge education is 0.58, the intervention group has a lower hazard of readmission than the usual-care group.
Cox regression should not be used mechanically. Students must check whether the model is clinically meaningful, whether the event coding is correct, whether there are enough events for the predictors included, and whether the proportional hazards assumption is reasonable. IBM identifies the proportional hazards assumption as the requirement that the hazard ratio should remain constant across time.
Kaplan-Meier vs Log-Rank Test vs Cox Regression
| Method | Main purpose | Main question answered | Uses predictors? | Main output | Nursing example | Best used when |
|---|---|---|---|---|---|---|
| Kaplan-Meier survival analysis | Estimate survival or event-free probability over time | What is the probability of remaining event-free at each time point? | No, except grouping/factor comparisons for curves | Survival curve, survival table, median survival time | Probability of remaining readmission-free after discharge | You need to describe and visualize time-to-event patterns |
| Log-rank test | Compare survival curves between groups | Do two or more groups differ in survival experience? | No multivariable adjustment | Chi-square statistic and p-value | Compare readmission-free survival between nurse-led education and usual care | You need a statistical comparison of Kaplan-Meier curves |
| Cox proportional hazards regression | Model predictors of time-to-event outcome | Which variables predict earlier or later event occurrence? | Yes | Hazard ratios, adjusted hazard ratios, confidence intervals, p-values | Predict time to readmission from intervention group, age, comorbidity, and discharge readiness | You need adjusted predictor analysis for a time-to-event outcome |
Survival Analysis Variables in Nursing Research
A survival analysis dataset usually needs a participant ID, time variable, event/status variable, and optional grouping or predictor variables.
| Variable type | Meaning | Example variable name | Example coding | Nursing research example |
|---|---|---|---|---|
| Participant ID | Unique identifier for each participant | ID | 001, 002, 003 | Each discharged patient has one record |
| Time variable | Time from start point to event or censoring | followup_days | 1, 7, 14, 30 | Days from discharge to readmission or last follow-up |
| Event/status variable | Whether the event occurred | readmit_status | 1 = readmitted, 0 = censored | Patient was readmitted or remained event-free |
| Grouping variable | Main comparison group | discharge_group | 1 = nurse-led education, 0 = usual care | Compare survival curves by discharge education group |
| Predictor variable | Variable used to predict time-to-event | age | Continuous years | Older age predicting earlier readmission |
| Covariate | Control variable included in Cox regression | comorbidity_index | 0–10 scale | Comorbidity burden adjusted in Cox model |
| Categorical predictor | Predictor with categories | unit_type | 1 = medical, 2 = surgical, 3 = cardiac | Unit type predicting pressure injury development |
| Continuous predictor | Numeric predictor | discharge_readiness_score | 0–100 | Higher readiness predicting lower readmission hazard |
Correct coding is essential. Many survival datasets use 1 = event occurred and 0 = censored, but students must verify the required coding in SPSS, R, Stata, SAS, or any other software before interpretation.
Assumptions and Requirements of Survival Analysis
Survival analysis requires careful planning before running any software procedure.
Clear event definition
The event must be specific and measurable.
Weak event definition:
Poor outcome after discharge.
Strong event definition:
First unplanned hospital readmission within 30 days after index discharge.
Accurate start and end time measurement
The dataset must include a valid start point and a valid event or censoring point. Incorrect dates can create negative follow-up times or impossible survival durations.
Independent observations
Basic survival analysis assumes each participant contributes an independent observation. If patients are clustered within hospitals, units, providers, or repeated episodes, advanced modeling may be needed.
Appropriate handling of censoring
Censoring should reflect the last time the participant was known to be event-free. NIH/NCBI warns that ignoring or excluding censored participants can bias survival analysis results.
Adequate number of events
Survival analysis depends on the number of observed events, not only the total sample size. This is especially important for Cox regression.
Correct event status coding
The event/status variable must distinguish event occurrence from censoring. Reversing the coding can completely change the meaning of the results.
No major data-entry errors
Students should check missing dates, impossible dates, duplicate IDs, negative follow-up times, and follow-up periods that exceed the study design.
Proportional hazards assumption for Cox regression
Cox regression assumes that hazard ratios are reasonably constant over time. IBM SPSS documentation identifies this as the proportional hazards assumption.
No severe multicollinearity among Cox predictors
Highly correlated predictors can make Cox estimates unstable. For example, including several overlapping severity scores may create interpretation problems.
Clinically meaningful covariate selection
Predictors should be selected based on the research question, theory, literature, clinical relevance, and event limitations. They should not be selected simply because they are available in the dataset.
Sample Size and Number of Events in Survival Analysis
Survival analysis sample size depends on both the total number of participants and the number of observed events.
A dissertation student may have 400 participants, but if only 15 patients experience the event, a Cox regression model with many predictors may be unstable. The model may overfit the data, produce wide confidence intervals, or create results that are difficult to defend.
Riley et al. (2019) explain that sample size for binary and time-to-event prediction models should consider the number of participants, number of outcome events, number of predictor parameters, anticipated model performance, and overfitting risk, not only a simple fixed events-per-variable rule.
Practical dissertation guidance:
- Report the total sample size.
- Report the number and percentage of events.
- Report the number and percentage censored.
- Keep Cox regression models focused when events are limited.
- Avoid adding predictors only to make the model look more advanced.
- Justify predictor selection in Chapter 3.
- Discuss limited events as a limitation when necessary.
- Seek statistical guidance before finalizing a complex Cox model.
A simple dissertation principle is this: a small number of observed events limits how complex the survival model can be.
How to Prepare Data for Survival Analysis
Before running survival analysis, students should prepare the dataset carefully.
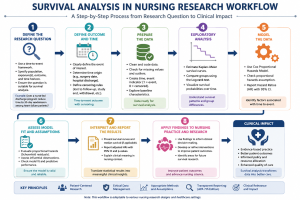
Steps:
- Create a unique participant ID.
- Define the event clearly.
- Identify the baseline or start date.
- Identify the event date or last follow-up date.
- Calculate follow-up time.
- Code event status correctly.
- Code censored cases correctly.
- Check impossible dates.
- Check missing values.
- Review outliers in follow-up time.
- Check group and predictor variables.
- Document all coding decisions.
Example dataset layout:
| ID | Group | Start date | Event date | Last follow-up date | Follow-up days | Event status | Age | Comorbidity score |
|---|---|---|---|---|---|---|---|---|
| 001 | Nurse-led education | 2026-01-01 | 2026-01-14 | 2026-01-14 | 13 | 1 | 68 | 4 |
| 002 | Usual care | 2026-01-03 | — | 2026-02-02 | 30 | 0 | 59 | 2 |
| 003 | Nurse-led education | 2026-01-05 | — | 2026-01-25 | 20 | 0 | 74 | 5 |
| 004 | Usual care | 2026-01-07 | 2026-01-10 | 2026-01-10 | 3 | 1 | 63 | 3 |
In this example:
- Follow-up days is the time variable.
- Event status is coded 1 = readmitted and 0 = censored.
- Participant 002 was not readmitted by day 30 and is censored at 30 days.
- Participant 003 was last contacted at day 20 without readmission and is censored at 20 days.
- Participants 001 and 004 experienced the event.
Common data preparation errors
| Error | Why it is a problem | How to fix it |
|---|---|---|
| Event date before start date | Produces negative follow-up time | Check date entry and eligibility |
| Missing last follow-up date | Censoring time cannot be calculated | Use documented last contact date or exclude according to missing-data plan |
| Event coded as 0 and censored as 1 by mistake | Reverses interpretation | Verify coding before analysis |
| Duplicate participant IDs | Violates independent observation assumption | Resolve duplicate records before analysis |
| Event definition changes across participants | Makes results inconsistent | Use one clear event definition |
| Follow-up time recorded in mixed units | Produces invalid survival times | Convert all follow-up times to one unit |
How to Run Survival Analysis in SPSS, R, Stata, SAS, or Python
Survival analysis can be performed in SPSS, R, Stata, SAS, Python, and other statistical programs. This pillar article gives an overview only. A separate supporting article should provide a full software tutorial.
SPSS
SPSS can run Kaplan-Meier survival analysis and Cox regression. IBM documentation places Kaplan-Meier under Analyze > Survival > Kaplan-Meier and Cox regression under Analyze > Survival > Cox Regression, depending on the installed SPSS edition or options.
SPSS is useful for students who need menu-based survival tables, Kaplan-Meier curves, log-rank tests, and Cox regression output.
R
R is powerful for Kaplan-Meier curves, log-rank tests, Cox regression, assumption checks, and publication-ready survival plots. It is suitable for students or analysts comfortable with code.
Stata
Stata is widely used in public health, epidemiology, and medical statistics. UCLA’s survival analysis seminar notes recommend examining Kaplan-Meier curves for categorical predictors before moving into more complex models because curves help students understand survival function shape and proportionality patterns.
SAS
SAS is common in clinical research and biostatistics. UCLA’s SAS survival analysis seminar describes nonparametric estimation through proc lifetest and Cox regression/model evaluation through proc phreg.
Python
Python can perform survival analysis through specialized packages, but students should only use it when they or their analyst can validate the model setup, event coding, censoring, and output interpretation.
How to Interpret Survival Analysis Output
Students should not copy software output directly into Chapter 4. They should extract the relevant statistics, format them properly, and interpret them in relation to the research question.
| Output item | What it means | What to look for | How to explain it in Chapter 4 |
|---|---|---|---|
| Total number of cases | Number included in analysis | Whether all eligible participants were included | “The analytic sample included 184 patients.” |
| Number of events | Participants who experienced the event | Whether enough events occurred for interpretation | “Forty-two patients experienced unplanned readmission.” |
| Number censored | Participants without observed event during follow-up | Whether censoring is high or imbalanced | “A total of 142 patients were censored.” |
| Censoring percentage | Proportion censored | Very high censoring may affect interpretation | “Most participants remained event-free or did not have the event observed during follow-up.” |
| Survival table | Survival probability at event times | Clinically meaningful time points | “The estimated probability of remaining readmission-free at day 30 was 0.84.” |
| Kaplan-Meier curve | Visual event-free probability over time | Curve separation, steep drops, censor marks | “The intervention group showed higher readmission-free survival across follow-up.” |
| Median survival time | Time when survival probability reaches 0.50 | Whether the median is reached | “Median time to readmission was not reached because fewer than half of participants were readmitted.” |
| Log-rank test result | Statistical comparison of curves | Chi-square statistic and p-value | “The log-rank test indicated a significant difference between groups.” |
| Cox regression coefficient | Log hazard estimate | Direction of predictor effect | Usually interpreted through hazard ratio |
| Hazard ratio | Relative hazard of event | Above 1 = higher hazard; below 1 = lower hazard, depending on coding | “Patients receiving nurse-led education had a lower hazard of readmission.” |
| Adjusted hazard ratio | Hazard ratio controlling for covariates | Whether effect remains after adjustment | “The intervention remained significant after adjusting for age and comorbidity.” |
| 95% confidence interval | Precision of estimate | Whether interval includes 1 for hazard ratios | “The confidence interval did not include 1.” |
| Model significance | Whether the Cox model is statistically meaningful | Overall model test | “The Cox model was statistically significant overall.” |
| Proportional hazards checks | Whether Cox assumption is reasonable | Diagnostic evidence or curve patterns | “The proportional hazards assumption was assessed before final interpretation.” |
How to Report Survival Analysis in APA 7th Edition
APA 7 reporting should be clear, complete, and readable. Students should not paste raw SPSS, R, Stata, or SAS output into Chapter 4. They should report the relevant statistics and explain what the results mean.
APA Style guidance recommends reporting exact p values, such as p = .015, unless the value is less than .001, in which case p < .001 is used. APA guidance also supports clear reporting of numerical results, tables, and figures.
When reporting survival analysis, include:
- Sample size
- Event definition
- Time variable
- Event/status coding
- Number of events
- Number censored
- Kaplan-Meier estimates
- Median survival time, if reached
- Log-rank test statistic, degrees of freedom, and p-value
- Cox regression hazard ratios
- Adjusted hazard ratios when covariates are included
- 95% confidence intervals
- Exact p-values
- Plain-language clinical interpretation
- Figure reference for survival curve
- Table reference for Cox regression results
Good reporting does not only say whether p < .05. It explains whether the result means earlier readmission, delayed wound healing, improved event-free survival, increased hazard, reduced hazard, or no statistically significant difference.
Example APA 7 Write-Up for Kaplan-Meier Survival Analysis
The following numbers are illustrative. Replace them with the student’s actual results.
A Kaplan-Meier survival analysis was conducted to compare 30-day readmission-free survival between patients who received nurse-led discharge education and patients who received usual discharge instructions. The event was defined as first unplanned hospital readmission within 30 days after discharge. Of the 160 patients included in the analysis, 38 experienced readmission and 122 were censored. The Kaplan-Meier curve showed higher readmission-free survival in the nurse-led education group across the follow-up period. At day 30, the estimated readmission-free survival probability was 0.84 for the nurse-led education group and 0.72 for the usual-care group. Median time to readmission was not reached in either group because fewer than 50% of participants experienced readmission. A log-rank test indicated a statistically significant difference in readmission-free survival between groups, χ²(1) = 5.42, p = .020. These findings suggest that patients who received nurse-led discharge education remained readmission-free for longer during the 30-day follow-up period.
Example APA 7 Write-Up for Cox Regression
The following numbers are illustrative. Replace them with the student’s actual results.
A Cox proportional hazards regression model was used to examine predictors of time to first unplanned readmission within 30 days after discharge. The model included discharge education group, age, comorbidity score, and discharge readiness score. After adjustment for covariates, nurse-led discharge education was associated with a lower hazard of readmission compared with usual care, adjusted HR = 0.58, 95% CI [0.36, 0.93], p = .024. This finding indicates that patients in the nurse-led education group had an estimated 42% lower hazard of readmission during follow-up, controlling for age, comorbidity, and discharge readiness. Higher comorbidity score was associated with an increased hazard of readmission, adjusted HR = 1.21, 95% CI [1.05, 1.39], p = .008. Age was not a statistically significant predictor, adjusted HR = 1.01, 95% CI [0.98, 1.04], p = .481.
Hazard ratios above 1 indicate a higher hazard of the event occurring sooner, while hazard ratios below 1 indicate a lower hazard, assuming the event is coded as the event of interest. Students must always interpret hazard ratios based on how the event variable was coded.
APA 7 Survival Analysis Reporting Checklist
| Reporting item | Why it matters | Included in Chapter 4? | Notes for students |
|---|---|---|---|
| Research question/hypothesis | Connects analysis to study purpose | Yes/No | State the time-to-event question clearly |
| Event definition | Prevents vague interpretation | Yes/No | Define the exact event |
| Time variable | Shows how follow-up was measured | Yes/No | Report days, weeks, months, or years |
| Event/status coding | Prevents reversed interpretation | Yes/No | State the event and censoring codes |
| Number of participants | Shows analytic sample | Yes/No | Report exclusions if any |
| Number of events | Shows how many experienced the outcome | Yes/No | Essential for survival interpretation |
| Number censored | Shows incomplete event observation | Yes/No | Report count and percentage |
| Statistical method | Identifies analysis used | Yes/No | Kaplan-Meier, log-rank, Cox regression |
| Survival curve | Provides visual interpretation | Yes/No | Include clear title and labels |
| Median survival time | Summarizes time-to-event | Yes/No/Not reached | Report only if meaningful |
| Log-rank test | Compares survival curves | Yes/No/Not applicable | Include χ², df, and p-value |
| Cox regression table | Shows predictor model | Yes/No/Not applicable | Include HR, 95% CI, and p-value |
| Hazard ratios | Main Cox interpretation | Yes/No/Not applicable | Do not call them odds ratios |
| Confidence intervals | Shows precision | Yes/No | Use APA-style 95% CI format |
| p-values | Shows statistical significance | Yes/No | Use exact p-values unless p < .001 |
| Plain-English interpretation | Makes results meaningful | Yes/No | Explain clinical meaning, not only statistics |
Common Mistakes Nursing Students Make in Survival Analysis
Common mistakes include:
- Using logistic regression when survival analysis is needed.
- Ignoring censored cases.
- Deleting censored participants incorrectly.
- Coding the event variable incorrectly.
- Treating all participants as if they had equal follow-up time.
- Reporting a survival curve without explaining it.
- Confusing survival probability with hazard.
- Reporting hazard ratios as odds ratios.
- Running Cox regression with too many predictors and too few events.
- Ignoring the proportional hazards assumption.
- Failing to define the start time clearly.
- Failing to define the event clearly.
- Mixing event dates and last follow-up dates incorrectly.
- Using calendar dates without calculating follow-up duration.
- Copying software output directly into Chapter 4.
- Reporting p-values without clinical interpretation.
- Claiming causation from observational Cox regression without design support.
- Forgetting to connect results back to research questions or hypotheses.
These errors can weaken the dissertation because survival analysis depends heavily on correct event definition, coding, censoring, and interpretation.
Survival Analysis in Chapter 3 Methodology
Chapter 3 should explain what survival analysis will be used for and how it will answer the research question. The methodology should be specific enough for the reader to understand the event, time variable, censoring rule, software, significance level, and planned analysis.
A strong Chapter 3 survival analysis section should include:
- Research design
- Population and sample
- Time-to-event outcome
- Event definition
- Follow-up period
- Censoring rule
- Grouping variable
- Predictor variables
- Statistical software
- Significance level
- Planned Kaplan-Meier analysis
- Planned log-rank test
- Planned Cox regression, if applicable
- Proportional hazards assumption check, if Cox regression is used
- Missing data handling
Sample Chapter 3 Methodology Paragraph
Survival analysis will be used to examine time to first unplanned hospital readmission within 30 days after discharge. The start time will be defined as the date of index hospital discharge. The event will be defined as the first unplanned readmission occurring within the 30-day follow-up period. Participants who are not readmitted by day 30, are lost to follow-up, transfer to another care system, or reach the end of available observation without readmission will be treated as censored at their last known follow-up time. Kaplan-Meier survival analysis will be used to estimate readmission-free survival probabilities over time. The log-rank test will compare survival curves between the nurse-led discharge education group and the usual-care group. If the number of observed events is adequate, Cox proportional hazards regression will be used to examine whether discharge education group predicts time to readmission after adjusting for age, comorbidity score, and discharge readiness. Hazard ratios, 95% confidence intervals, and p-values will be reported. The proportional hazards assumption will be assessed before interpreting the Cox regression model. Statistical significance will be evaluated at α = .05.
Survival Analysis in Chapter 4 Results
Chapter 4 should present survival analysis findings clearly and in the same order as the research questions or hypotheses.
Chapter 4 should include:
- Participant flow or analytic sample
- Descriptive statistics
- Number of participants
- Number of events
- Number censored
- Kaplan-Meier curve
- Survival probability estimates
- Median survival time, if applicable
- Log-rank test, if groups are compared
- Cox regression table, if predictors are modeled
- APA-style interpretation
- Connection back to research questions or hypotheses
Sample Chapter 4 Results Paragraph
The analytic sample included 160 patients discharged from the medical-surgical units. The event was first unplanned readmission within 30 days. Overall, 38 patients experienced readmission and 122 were censored. Kaplan-Meier analysis showed that readmission-free survival remained higher in the nurse-led discharge education group than in the usual-care group throughout the follow-up period. At day 30, the estimated readmission-free survival probability was 0.84 for the nurse-led education group and 0.72 for the usual-care group. The log-rank test showed a statistically significant difference between the survival curves, χ²(1) = 5.42, p = .020. A Cox proportional hazards model was then conducted to adjust for age, comorbidity score, and discharge readiness. Nurse-led discharge education was associated with a lower hazard of readmission, adjusted HR = 0.58, 95% CI [0.36, 0.93], p = .024. These findings support the hypothesis that nurse-led discharge education improves readmission-free survival during the 30-day follow-up period.
Survival Analysis Tables and Figures
Useful survival analysis tables and figures include:
| Table or figure | Purpose | Dissertation use |
|---|---|---|
| Participant/event summary table | Shows sample size, events, and censoring | Chapter 4 sample description |
| Censoring summary table | Shows how many participants were censored and why | Methods transparency and results interpretation |
| Kaplan-Meier survival curve | Displays event-free probability over time | Main visual figure |
| Survival probability table | Reports survival estimates at key time points | Supports clinical interpretation |
| Log-rank test table | Compares survival curves between groups | Hypothesis testing |
| Cox regression hazard ratio table | Reports predictors, HRs, CIs, and p-values | Multivariable results |
| Optional forest plot | Displays hazard ratios visually | Publication-ready presentation |
A dissertation should use clean, formatted tables rather than raw software exports. APA-style tables should have clear titles, consistent decimal places, readable labels, and explanatory notes.
Trust and Accuracy: Why Survival Analysis Needs Careful Handling
Survival analysis can be powerful, but results are only useful when the method is handled carefully. A small coding error can change the entire conclusion. If a student accidentally codes censored cases as events, the Kaplan-Meier curve, log-rank test, and Cox regression model will all be wrong.
Survival analysis requires accuracy in:
- Event definition
- Start time
- End time
- Follow-up duration
- Censoring rules
- Event/status coding
- Software setup
- Assumption checks
- Hazard ratio interpretation
- APA 7 reporting
Errors in survival analysis can affect both Chapter 3 and Chapter 4. A weak Chapter 3 may fail to justify why survival analysis was selected. A weak Chapter 4 may report hazard ratios as odds ratios, ignore censored observations, or present Kaplan-Meier curves without interpretation.
For nursing dissertation students, the goal is not only to “run the test.” The goal is to select the correct method, prepare the data accurately, interpret the output responsibly, and explain the findings in a way that aligns with the research question and clinical context.
Survival Analysis Help for Nursing Dissertations
Students often need survival analysis support when:
- They are unsure whether their outcome is time-to-event.
- They do not know whether to use Kaplan-Meier, log-rank test, or Cox regression.
- They are unsure how to code censored cases.
- Their SPSS, R, Stata, SAS, or Python output is confusing.
- They need Kaplan-Meier curves explained.
- They need Cox regression hazard ratios interpreted.
- Their supervisor requested APA 7 reporting.
- Their Chapter 4 needs clean tables, figures, and interpretation.
- Their Chapter 3 methodology needs a clear survival analysis plan.
- Their dataset includes dates but not a prepared follow-up time variable.
- Their Cox regression model has too many predictors for the number of events.
- Their survival curve looks unusual and needs explanation.
Nursing Dissertation Help can support survival analysis planning, data preparation, Kaplan-Meier curves, log-rank tests, Cox proportional hazards regression, hazard ratio interpretation, SPSS/R/Stata/SAS output interpretation, APA 7 tables, Chapter 3 methodology writing, and Chapter 4 dissertation-ready reporting.
For related support, see:
- Dissertation Data Analysis Help
- Regression Analysis Help
- Statistical Tests in Nursing Research
- SPSS Multivariate Analysis
FAQs About Survival Analysis in Nursing Research
1. What is survival analysis in nursing research?
Survival analysis in nursing research is a statistical method used to examine how long it takes for a clinically meaningful event to occur. The event may be readmission, wound healing, infection, relapse, discharge, treatment discontinuation, or mortality.
2. Is survival analysis only used for death or mortality?
No. Survival analysis can be used for many healthcare events, including hospital readmission, pressure injury development, wound healing, post-operative infection, relapse, medication discontinuation, and treatment completion.
3. What is time-to-event data?
Time-to-event data records the amount of time from a defined starting point until an event occurs or until the participant is censored.
4. What is censored data?
Censored data occurs when the event has not been observed for a participant during the available follow-up period. The participant still contributes useful follow-up information up to the censoring time.
5. What is right censoring?
Right censoring occurs when a participant has not experienced the event by the end of the study or is lost before the event is observed. For example, a patient who is not readmitted by day 30 is right-censored at 30 days.
6. What is Kaplan-Meier survival analysis?
Kaplan-Meier survival analysis estimates the probability of remaining event-free over time. It is commonly used to create survival curves and summarize survival probability at specific time points.
7. What is the log-rank test?
The log-rank test compares survival curves between two or more groups. It can test whether readmission-free survival differs between an intervention group and a usual-care group.
8. What is Cox proportional hazards regression?
Cox proportional hazards regression models predictors of time-to-event outcomes. It estimates hazard ratios that show whether predictors are associated with higher or lower hazard of the event occurring sooner.
9. What is a hazard ratio?
A hazard ratio compares the hazard of an event between groups or across predictor levels. A hazard ratio above 1 usually indicates higher hazard, while a hazard ratio below 1 usually indicates lower hazard, depending on event coding.
10. What is the difference between odds ratio and hazard ratio?
An odds ratio usually comes from logistic regression and compares the odds that an event occurred. A hazard ratio comes from survival analysis and compares the hazard of an event occurring over time.
11. What is the difference between logistic regression and survival analysis?
Logistic regression examines whether an event occurred. Survival analysis examines when the event occurred and accounts for follow-up time and censored observations.
12. Can SPSS run survival analysis?
Yes. SPSS can run Kaplan-Meier survival analysis and Cox regression when the dataset includes a time variable, an event/status variable, and any grouping or predictor variables needed for the analysis.
13. How do I report survival analysis in APA 7th edition?
Report the sample size, number of events, number censored, survival estimates, median survival time if available, log-rank test results, Cox regression hazard ratios, 95% confidence intervals, p-values, and plain-language interpretation.
14. When should I get help with survival analysis?
You should get help when you are unsure whether your outcome is time-to-event, when censoring is confusing, when your event variable may be coded incorrectly, when Cox regression assumptions are unclear, or when you need APA 7 Chapter 4 reporting.
Conclusion
Survival analysis in nursing research is the correct statistical approach when the research question focuses on how long it takes for an event to occur. It is especially useful for dissertation studies involving readmission, wound healing, pressure injury development, infection, relapse, treatment discontinuation, treatment completion, discharge, or mortality.
The method requires more than selecting a test from a software menu. Nursing students must define the event correctly, calculate follow-up time accurately, code censored cases properly, choose between Kaplan-Meier analysis, log-rank testing, and Cox regression, check assumptions, interpret hazard ratios carefully, and report findings in APA 7th edition format.
When done well, survival analysis can make Chapter 3 stronger, Chapter 4 clearer, and the dissertation more clinically meaningful. When done poorly, errors in event coding, censoring, or hazard ratio interpretation can weaken the entire results section.
Nursing Dissertation Help can support students with survival analysis planning, Kaplan-Meier curves, log-rank tests, Cox proportional hazards regression, hazard ratio interpretation, SPSS/R/Stata/SAS output interpretation, Chapter 3 methodology support, and Chapter 4 dissertation-ready APA 7 reporting.
References
American Psychological Association. (2024). Numbers and statistics guide. APA Style. https://apastyle.apa.org/instructional-aids/numbers-statistics-guide.pdf
Bewick, V., Cheek, L., & Ball, J. (2004). Statistics review 12: Survival analysis. Critical Care, 8, 389–394. https://doi.org/10.1186/cc2955
Bland, J. M., & Altman, D. G. (1998). Survival probabilities: The Kaplan-Meier method. BMJ, 317(7172), 1572. https://doi.org/10.1136/bmj.317.7172.1572
Bland, J. M., & Altman, D. G. (2004). The logrank test. BMJ, 328(7447), 1073. https://doi.org/10.1136/bmj.328.7447.1073
Columbia University Mailman School of Public Health. (n.d.). Time-to-event data analysis. https://www.publichealth.columbia.edu/research/population-health-methods/time-event-data-analysis
Denfeld, Q. E., Burger, D., & Lee, C. S. (2023). Survival analysis 101: An easy start guide to analysing time-to-event data. European Journal of Cardiovascular Nursing, 22(3), 332–337. https://doi.org/10.1093/eurjcn/zvad023
IBM. (n.d.-a). Kaplan-Meier survival analysis. IBM SPSS Statistics 30.0.0. https://www.ibm.com/docs/en/spss-statistics/30.0.0?topic=statistics-kaplan-meier-survival-analysis
IBM. (n.d.-b). Cox regression analysis. IBM SPSS Statistics 30.0.0. https://www.ibm.com/docs/en/spss-statistics/30.0.0?topic=statistics-cox-regression-analysis
Riley, R. D., Snell, K. I. E., Ensor, J., Burke, D. L., Harrell, F. E., Jr., Moons, K. G. M., & Collins, G. S. (2019). Minimum sample size for developing a multivariable prediction model: Part II—Binary and time-to-event outcomes. Statistics in Medicine, 38(7), 1276–1296. https://doi.org/10.1002/sim.7992
Schober, P., & Vetter, T. R. (2018). Survival analysis and interpretation of time-to-event data: The tortoise and the hare. Anesthesia & Analgesia, 127(3), 792–798. https://doi.org/10.1213/ANE.0000000000003653
Shreffler, J., & Huecker, M. R. (2023). Survival analysis. In StatPearls. StatPearls Publishing. https://www.ncbi.nlm.nih.gov/books/NBK560604/
UCLA Office of Advanced Research Computing. (n.d.-a). Survival analysis with Stata. https://stats.oarc.ucla.edu/stata/seminars/stata-survival/
UCLA Office of Advanced Research Computing. (n.d.-b). Introduction to survival analysis in SAS. https://stats.oarc.ucla.edu/sas/seminars/sas-survival/
