

Introduction
Many nursing and healthcare students collect questionnaire data in SPSS but struggle when the instrument has many Likert-scale items. The dataset may look complete, yet the student may not know whether the items measure one construct, several hidden dimensions, or a confusing mix of unrelated ideas.
That is where SPSS factor analysis becomes useful. It helps students explore how related survey items group together before creating subscales, reducing items, or interpreting questionnaire structure. For example, a 15-item patient education confidence questionnaire may contain separate dimensions for patient teaching, communication confidence, and documentation confidence.
The real challenge is not only clicking through SPSS. Students must know whether factor analysis is appropriate, whether the sample is suitable, how to read KMO and Bartlett’s test, what factor loadings mean, how to interpret the rotated component matrix, and how to report the results in APA 7th edition format.
Need help running SPSS factor analysis for your questionnaire data? Our SPSS Data Analysis Help service can help you check your dataset, run the analysis, interpret factor loadings, and prepare APA-style results for your nursing research.
What Is SPSS Factor Analysis?
SPSS factor analysis is a statistical procedure used to examine whether several observed questionnaire items can be grouped into fewer underlying factors, dimensions, or components. IBM describes factor analysis as a method used to identify underlying variables that explain patterns of correlations among observed variables (IBM Corp., n.d.).
In nursing research, this is common when students use multi-item questionnaires. Instead of treating 20 survey items as separate outcomes, factor analysis may show that the items cluster into smaller groups, such as clinical confidence, communication confidence, and patient education confidence.
Students often use factor analysis for questionnaire development, survey item reduction, scale structure exploration, subscale identification, construct measurement, and healthcare survey analysis.
Factor analysis should answer a practical question: do these questionnaire items form meaningful groups that support the way the instrument is used in the study?
When Should Nursing Students Use Factor Analysis in SPSS?
Use factor analysis in SPSS when you have several related items that may measure one or more underlying constructs. It is most useful when your study uses patient satisfaction questionnaires, medication adherence scales, nursing confidence scales, burnout instruments, clinical competence tools, patient education perception scales, attitude surveys, knowledge questionnaires, or health behavior instruments.
For example, a nursing student may want to know whether a patient satisfaction questionnaire has separate factors for communication, responsiveness, discharge education, and emotional support. Factor analysis can help explore that structure.
Do not use factor analysis for single-item variables, basic demographic variables, a few unrelated survey questions, or variables that do not measure a shared concept. Age, gender, marital status, diagnosis, employment status, and one yes/no item do not belong in factor analysis.
Use caution with very small datasets. Factor analysis is sensitive to sample size, item quality, communalities, and the strength of relationships among variables. A weak dataset can produce unstable or misleading factors.
SPSS Factor Analysis vs Reliability Analysis
Factor analysis and reliability analysis answer different questions.
Factor analysis explores how items group together. It helps you identify possible factors, components, or subscales within a questionnaire. Reliability analysis checks whether the items inside a scale or subscale are consistent enough to be used together.
A student may run factor analysis first to explore the questionnaire structure. After identifying factors or subscales, the student may then run Cronbach’s alpha for each retained factor. For example, if factor analysis suggests three subscales, reliability analysis should usually be conducted separately for each subscale.
Do not replace one with the other. Factor analysis does not prove reliability, and Cronbach’s alpha does not show how items should group into factors. The two procedures support different parts of questionnaire analysis.
Exploratory Factor Analysis vs Principal Component Analysis in SPSS
Students often confuse exploratory factor analysis in SPSS with principal component analysis in SPSS because both appear under the SPSS Factor procedure and both can produce matrices, eigenvalues, variance tables, and rotated solutions.
Exploratory factor analysis is used when the goal is to explore latent constructs that may explain relationships among measured items. Principal component analysis is mainly used for data reduction, where the goal is to summarize many observed variables into fewer components.
These methods are not identical. Fabrigar, Wegener, MacCallum, and Strahan argued that researchers must make careful decisions when using EFA because choices about extraction, rotation, and factor retention affect the final result (Fabrigar et al., 1999). Watkins also emphasized that EFA requires thoughtful methodological decisions rather than automatic use of software defaults (Watkins, 2018).
Choose the method based on your research purpose, methodology chapter, questionnaire type, previous literature, and supervisor guidance.
Before Running Factor Analysis in SPSS
Before running factor analysis, review the questionnaire carefully. Confirm that the items are conceptually related and that it makes sense to search for underlying dimensions.
Check that Likert-scale items are coded consistently. If higher scores represent stronger confidence, agreement, satisfaction, or knowledge, all items should follow that direction. Reverse-coded items must be corrected before analysis.
Review missing values, out-of-range values, variable labels, value labels, and response distributions. This preparation connects closely with Data Cleaning Steps in Nursing Research because coding errors can distort the correlation matrix used in factor analysis.
You should also inspect frequencies, means, standard deviations, and item distributions before running the analysis. Read our article on Descriptive Data Analysis in Nursing Research because factor analysis should not begin before basic data screening.
If the questionnaire already has known subscales, decide whether to analyze all items together or analyze subscales separately.
Assumptions and Suitability Checks for SPSS Factor Analysis
Sample Size
Larger samples usually produce more stable factor solutions, but there is no single universal sample-size rule. Suitability depends on the number of items, strength of factor loadings, communalities, number of expected factors, and quality of the questionnaire. Costello and Osborne note that sample size is one of several decisions that affect EFA quality (Costello & Osborne, 2005).
Correlation Matrix
Factor analysis needs meaningful relationships among items. If the items are not correlated, there may be no shared structure to extract.
KMO Measure
The Kaiser-Meyer-Olkin measure helps assess sampling adequacy. IBM explains that KMO tests whether partial correlations among variables are small, which helps evaluate whether the data are suitable for factor analysis (IBM Corp., n.d.).
Bartlett’s Test of Sphericity
Bartlett’s test checks whether the correlation matrix is an identity matrix. A significant result suggests the items are sufficiently related to proceed with factor analysis.
How to Run Factor Analysis in SPSS
To run factor analysis in SPSS:
- Open the dataset in SPSS.
- Click Analyze.
- Select Dimension Reduction.
- Click Factor.
- Move related questionnaire items into the Variables box.
- Click Descriptives.
- Select KMO and Bartlett’s test of sphericity.
- Click Continue.
- Click Extraction.
- Choose the extraction method required by the study.
- Select Scree plot if needed.
- Click Continue.
- Click Rotation.
- Choose the rotation method that fits the study.
- Click Options.
- Suppress small coefficients if helpful.
- Click Continue.
- Click OK.
IBM lists factor analysis under Analyze > Dimension Reduction > Factor and identifies outputs such as KMO, Bartlett’s test, communalities, eigenvalues, variance explained, factor loadings, rotated matrices, and scree plots (IBM Corp., n.d.).
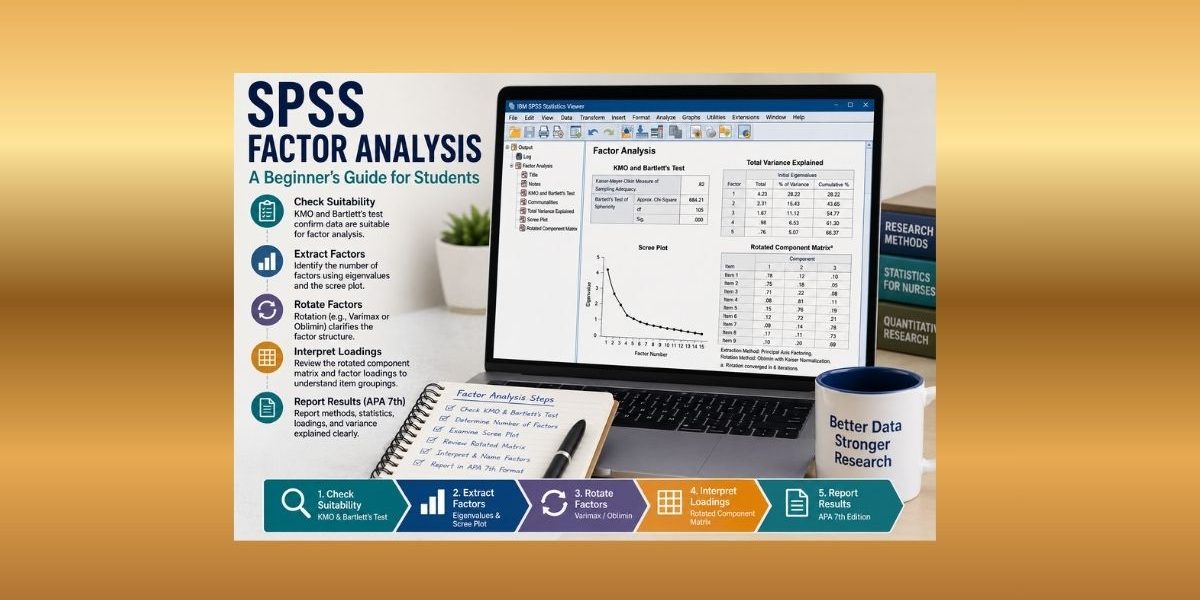
SPSS Factor Analysis Output: What to Read
KMO and Bartlett’s Test
This table helps you decide whether factor analysis is suitable. A stronger KMO supports sampling adequacy. A significant Bartlett’s test suggests the correlation matrix is not an identity matrix.
Communalities
Communalities show how much variance in each item is explained by the extracted factors. Low communalities may suggest that an item is not well represented by the factor solution.
Total Variance Explained
This table shows how many factors or components were extracted and how much variance they explain. It also shows eigenvalues, which many students use when deciding how many factors to retain.
Scree Plot
The scree plot visually displays eigenvalues. Students use it to identify where the curve starts to flatten, which may suggest a reasonable number of factors.
Rotated Component Matrix or Pattern Matrix
This table shows factor loadings. It helps students decide which items belong to which factor after rotation.
How to Interpret Factor Loadings in SPSS
A factor loading shows how strongly an item relates to a factor. Higher absolute values suggest a stronger relationship. Positive and negative signs show direction, but the size of the loading usually matters most when deciding whether an item belongs to a factor.
Ideally, each item should load clearly on one factor. If an item loads strongly on two or more factors, it is called a cross-loading item. Cross-loading items may confuse the factor structure and should be reviewed carefully.
Low-loading items may not fit the factor solution well. However, do not delete an item only because it has a weak loading. Review the item wording, theory, questionnaire source, sample, and supervisor guidance.
Avoid one rigid cutoff for all studies. Loading expectations may vary by field, sample size, research purpose, and instrument type. A dissertation should justify its decisions instead of relying only on software output.
How to Decide the Number of Factors
Factor retention should not be mechanical. Do not keep factors only because their eigenvalues are greater than 1. That rule is common, but it can overextract or underextract factors depending on the dataset.
Use several pieces of evidence: eigenvalues, scree plot, variance explained, factor loadings, theoretical meaning, interpretability, previous literature, and supervisor or committee guidance. Costello and Osborne caution that EFA involves several decisions, including extraction, rotation, factor retention, and sample size, and those decisions should be made carefully rather than automatically (Costello & Osborne, 2005).
A factor solution should make both statistical and conceptual sense. If SPSS suggests four factors but only two have clear nursing meaning, you need to review the output, questionnaire structure, and research purpose before reporting the result.
Rotation Methods in SPSS Factor Analysis
Rotation makes factor patterns easier to interpret. After extraction, items may not load clearly on simple factors. Rotation adjusts the solution so that item groupings become clearer.
Varimax is an orthogonal rotation often used when factors are assumed to be unrelated. Oblimin and promax are oblique rotations used when factors may be correlated. IBM notes that SPSS offers several rotation methods, including direct oblimin and promax for nonorthogonal rotations (IBM Corp., n.d.).
In nursing and healthcare research, constructs are often related. For example, communication confidence, patient education confidence, and clinical confidence may correlate. If factors are likely related, an oblique rotation may be more defensible.
The rotation method should match your methodology, research question, and supervisor guidance.
Common Mistakes Students Make in SPSS Factor Analysis
Common mistakes include:
- Running factor analysis on unrelated items
- Using factor analysis when reliability analysis was the real need
- Ignoring KMO and Bartlett’s test
- Treating PCA and EFA as the same method
- Choosing factors only because eigenvalues are greater than 1
- Ignoring the scree plot
- Keeping weak-loading items without explanation
- Deleting cross-loading items without theoretical justification
- Forgetting to correct reverse-coded items
- Reporting SPSS tables without interpretation
- Claiming factor analysis proves validity
- Failing to connect factors to the questionnaire or research questions
Factor analysis can support evidence about questionnaire structure, but it does not prove validity by itself. A stronger dissertation explains the decisions behind the analysis.
If your SPSS factor analysis output has weak KMO values, confusing factor loadings, cross-loading items, or unclear rotated matrices, our Dissertation Data Analysis Help service can help you interpret the results and write them clearly.
How to Report SPSS Factor Analysis in APA 7th Edition
Factor analysis APA reporting should explain what was done, why it was done, and what the output showed. Report the purpose of the analysis, number of items, sample size, extraction method, rotation method, KMO value, Bartlett’s test result, retained factors, variance explained, major factor loadings, removed items, and factor names.
APA Style guidance emphasizes clear statistical reporting, including readable numbers and results linked to interpretation (American Psychological Association, 2024).
A sample write-up may look like this:
“An exploratory factor analysis was conducted to examine the structure of the 15-item nursing communication confidence scale. The Kaiser-Meyer-Olkin measure indicated adequate sampling suitability, KMO = .82, and Bartlett’s test of sphericity was statistically significant, χ²(105) = 684.21, p < .001. A three-factor solution was retained based on the scree plot, factor loadings, and interpretability. The retained factors represented patient education confidence, therapeutic communication confidence, and interprofessional communication confidence.”
Replace all placeholder values with your exact SPSS output.
SPSS Factor Analysis Example for Nursing Research
A nursing student develops a 15-item patient education confidence questionnaire measured on a 5-point Likert scale. The student wants to know whether the items form one confidence scale or several subscales.
First, the student checks missing values, item coding, and reverse-coded items. Next, the student runs factor analysis in SPSS and requests KMO and Bartlett’s test. The KMO value is acceptable, and Bartlett’s test is significant, so the student proceeds cautiously.
The communalities show whether each item is represented by the factor solution. One item has a very low communality, so the student reviews its wording before deciding whether to keep it.
The scree plot suggests three possible factors. The rotated component matrix shows that five items load on patient teaching confidence, five items load on communication confidence, and four items load on documentation confidence. One item cross-loads and needs review.
After deciding which items belong to each factor, the student may run Cronbach’s alpha separately for each subscale. This helps check whether the retained items within each factor work consistently enough to form subscale scores.
How Factor Analysis Supports Quantitative Nursing Research
Factor analysis supports quantitative nursing research by helping students understand questionnaire structure. It may identify subscales, reduce items, or clarify whether survey items measure meaningful dimensions.
After factor analysis, students may create scale or subscale scores and use them in descriptive statistics, correlations, t-tests, ANOVA, regression, or other quantitative procedures. This connects with Types of Quantitative Data Analysis because factor analysis often prepares questionnaire data for later statistical testing.
However, factor analysis should not be treated as a shortcut. A factor solution must be interpreted in light of theory, item wording, sample quality, and the research purpose.
When to Get Help With SPSS Factor Analysis
Get help when you are unsure whether factor analysis is appropriate for your questionnaire. Support may also be useful when your dataset has missing values, reverse-coded items, weak item correlations, or unclear SPSS output.
Students often need guidance when KMO is low, Bartlett’s test is not significant, the scree plot is unclear, factor loadings are weak, or items cross-load on multiple factors. These problems require interpretation, not just screenshots from SPSS.
Help is also important when EFA and PCA are being confused, a supervisor requests revisions, or the results chapter needs APA-style reporting. Professional support can help you connect factor analysis to reliability analysis, subscale creation, and later quantitative testing.
For SPSS output interpretation and results reporting, SPSS Data Analysis Help can support your questionnaire analysis from dataset setup to final write-up.
Conclusion
SPSS factor analysis helps nursing and healthcare students examine whether questionnaire items group into meaningful factors before creating subscales, reducing items, or interpreting survey results. It is especially useful for Likert-scale instruments used in dissertations, theses, capstones, and healthcare research projects.
Good factor analysis requires more than clicking through SPSS. Students must consider theory, item wording, data cleaning, missing values, KMO and Bartlett’s test, extraction, rotation, factor loadings, rotated matrices, and APA reporting.
Need expert help with SPSS factor analysis, KMO and Bartlett’s test, factor loadings, rotated component matrices, or APA 7th edition reporting? Upload your dataset, questionnaire, research questions, and rubric through our SPSS Data Analysis Help page for focused nursing research support.
FAQs
1. What is SPSS factor analysis?
SPSS factor analysis is a procedure used to explore how related questionnaire items group into underlying factors, dimensions, or components.
2. When should I use factor analysis in SPSS?
Use it when you have several related questionnaire or Likert-scale items and need to examine their structure before creating subscales or reducing items.
3. What is KMO in SPSS factor analysis?
KMO is the Kaiser-Meyer-Olkin measure of sampling adequacy. It helps show whether the data are suitable for factor analysis.
4. What are factor loadings in SPSS?
Factor loadings show how strongly each item relates to a factor. Stronger loadings help identify which items belong to each factor.
5. How do I report factor analysis in APA 7th edition format?
Report the purpose, sample size, number of items, extraction method, rotation method, KMO, Bartlett’s test, retained factors, variance explained, factor loadings, and any item-removal decisions.
References
American Psychological Association. (2024). Numbers and statistics guide.
Costello, A. B., & Osborne, J. W. (2005). Best practices in exploratory factor analysis: Four recommendations for getting the most from your analysis. Practical Assessment, Research, and Evaluation, 10(7), Article 7.
Fabrigar, L. R., Wegener, D. T., MacCallum, R. C., & Strahan, E. J. (1999). Evaluating the use of exploratory factor analysis in psychological research. Psychological Methods, 4(3), 272–299.
IBM Corp. (n.d.). Factor analysis. IBM Documentation.
IBM Corp. (n.d.). Factor analysis descriptives. IBM Documentation.
Watkins, M. W. (2018). Exploratory factor analysis: A guide to best practice. Journal of Black Psychology, 44(3), 219–246.
