

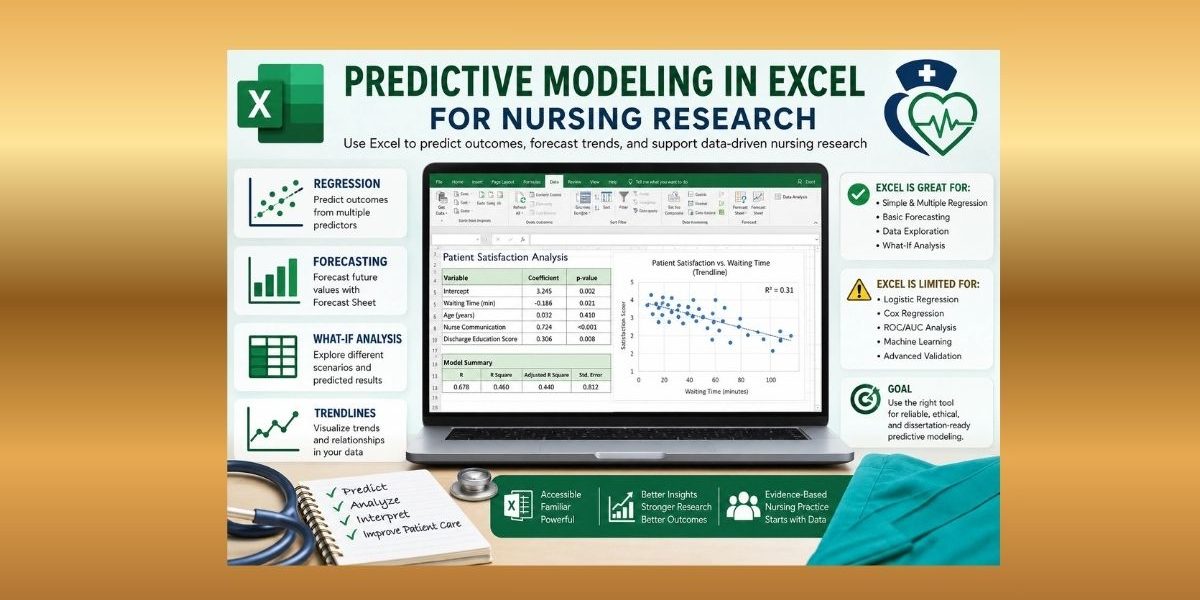
Many nursing students use Excel because it is familiar, accessible, and useful for organizing data, creating charts, running simple regression, and exploring trends. Predictive modeling in Excel can support basic predictive tasks such as linear regression, multiple regression, trendline prediction, Excel Forecast Sheet, simple forecasting, and what-if analysis.
However, Excel has clear limits. It is not the best tool for advanced healthcare prediction models such as logistic regression, Cox regression, ROC/AUC analysis, random forests, gradient boosting, neural networks, cross-validation, or complex dissertation-ready model validation.
Predictive modeling examples in this article are for nursing research and educational purposes only. They should not be used as diagnosis, treatment advice, or independent clinical decision-making tools.
What Is Predictive Modeling in Excel?
Predictive modeling in Excel means using Excel tools, formulas, charts, regression output, trendlines, and forecasting features to estimate future or unknown outcomes from existing data.
For nursing students, this may include predicting patient satisfaction scores from waiting time and nurse communication scores, forecasting monthly clinic visits, estimating future staffing demand, or predicting quality-of-life scores from pain score, age, and treatment adherence.
This article focuses only on Excel as a basic prediction tool. For a broader explanation of prediction models, outcome variables, validation, and model evaluation, read the guide on predictive modelling in nursing research.
When Can Nursing Students Use Excel for Predictive Modeling?
Excel may be useful for small dissertation datasets, simple linear regression, multiple linear regression, trend-based forecasting, early data exploration, and preparing data before using SPSS, R, Stata, or Python.
It can also help students create simple charts for dissertation results. For example, a nursing student may use Excel to explore whether waiting time appears related to patient satisfaction before running stronger analysis in SPSS or R.
Still, students should check supervisor and university expectations before relying on Excel for final analysis. Some supervisors may accept Excel for basic regression, while others may require SPSS, R, Stata, or Python for more complete statistical output.
For broader Excel cleaning, sorting, charting, and descriptive analysis, see using Excel for data analysis. This article stays focused on Excel-based prediction.
What Excel Can and Cannot Do for Predictive Modeling
| Predictive task | Can Excel do it? | Nursing dissertation comment |
|---|---|---|
| Data cleaning | Yes, basic | Useful for preparing data, but not enough for advanced modelling |
| Descriptive statistics | Yes | Good before regression or forecasting |
| Scatterplots | Yes | Useful for exploring relationships |
| Correlation | Yes | Helpful for early exploration, not final prediction alone |
| Simple linear regression | Yes | Suitable for one continuous outcome and one predictor |
| Multiple linear regression | Yes | Suitable for one continuous outcome and several predictors |
| Trendline prediction | Yes | Useful for visual exploration, not enough for a full results chapter |
| Forecast Sheet | Yes | Useful for time-based forecasting such as clinic visits |
| What-if analysis | Yes | Useful for exploring possible changes in predicted values |
| Logistic regression | Not properly | Use SPSS, R, Stata, or Python for categorical outcomes |
| Cox regression | No | Use SPSS, Stata, R, or Python for time-to-event outcomes |
| ROC/AUC analysis | Limited | Better in SPSS, R, Stata, or Python |
| Random forest | No | Use R or Python |
| Neural networks | No | Use Python, R, or specialist software |
| Advanced validation | Limited | Weak for train/test splits, cross-validation, and bootstrapping |
| APA-ready reporting | Limited | Output must be interpreted and formatted manually |
The main message is simple: Excel is useful for basic prediction and forecasting, but SPSS, R, Stata, or Python is usually better for advanced dissertation analysis.
Predictive Modeling Methods You Can Use in Excel
Linear Regression in Excel
Linear regression predicts a continuous outcome. In nursing research, this may include a pain score, patient satisfaction score, anxiety score, quality-of-life score, or burnout score.
For example, a nursing student may ask whether waiting time and nurse communication score predict patient satisfaction. If satisfaction is measured as a numeric score, linear regression may be appropriate.
Excel can perform regression analysis using the Data Analysis ToolPak or regression functions in the desktop application (Microsoft Support, n.d.). Students should review coefficients, R-squared, adjusted R-squared, standard error, p-values, residuals, and practical meaning.
Multiple Regression in Excel
Multiple regression uses several predictors to estimate one continuous outcome.
For example, a dissertation may test whether age, length of stay, pain score, and discharge education score predict quality-of-life score after discharge. Excel can run this analysis if the data are clean, numeric variables are coded correctly, and the outcome is continuous.
However, students must still understand assumptions, missing data, variable coding, and interpretation. Regression should not be treated as a button-clicking exercise. Penn State’s regression notes describe regression methods as ways to model how a response variable relates to explanatory variables (Penn State Department of Statistics, n.d.).
Trendline Prediction in Excel
Excel chart trendlines can show a simple relationship between two variables. Students may add a linear, exponential, or moving average trendline to a chart. Excel also allows users to display the trendline equation and R-squared value on the chart (Microsoft Support, n.d.).
Trendlines are useful for visual exploration. For example, a student may create a scatterplot showing the relationship between waiting time and patient satisfaction. However, a trendline should not replace a full regression results section.
Forecast Sheet in Excel
Excel Forecast Sheet estimates future values from time-based data. Microsoft explains that users can select time-based data, open Forecast Sheet from the Data tab, and create a forecast worksheet (Microsoft Support, n.d.).
In nursing and public health research, Forecast Sheet may help estimate monthly clinic visits, weekly patient falls, monthly infection rates, staffing demand, or missed appointments.
Forecasting depends on data quality, time span, seasonality, and whether past patterns continue. Forecasting texts also emphasise prediction intervals because uncertainty usually increases as forecasts move further into the future (Hyndman & Athanasopoulos, 2021).
What-If Analysis in Excel
What-if analysis helps students explore how changing one input may affect a predicted value. Excel includes Scenarios, Goal Seek, and Data Tables for what-if analysis (Microsoft Support, n.d.).
For example, a student may explore how shorter waiting time could change predicted patient satisfaction based on a regression equation. However, what-if analysis does not prove cause and effect.
Step-by-Step Workflow for Predictive Modeling in Excel
- Define the nursing research question.
- Identify the outcome variable.
- Identify predictor variables.
- Enter or import the data into Excel.
- Clean and code the data briefly.
- Use charts to explore patterns.
- Enable the Data Analysis ToolPak.
- Run regression or Forecast Sheet.
- Review the output carefully.
- Interpret the model in nursing language.
- Check whether Excel is enough.
- Report results cautiously and explain limitations.
A strong Excel-based predictive modeling project should not stop at output. The student must explain what the model predicts, what the results mean, and what Excel cannot do.
How to Enable the Data Analysis ToolPak in Excel
The Excel Data Analysis ToolPak allows users to run basic statistical procedures, including regression. Microsoft’s official instructions explain that users can load it through File, Options, Add-ins, Excel Add-ins, Go, and then selecting Analysis ToolPak (Microsoft Support, n.d.).
Basic steps:
- Go to File.
- Select Options.
- Choose Add-ins.
- Select Excel Add-ins.
- Click Go.
- Check Analysis ToolPak.
- Click OK.
- Open the Data tab.
- Select Data Analysis.
After enabling it, students can use the Regression tool for basic Excel regression analysis.
Example: Predicting Patient Satisfaction Score in Excel
A nursing student wants to predict patient satisfaction score using waiting time, age, nurse communication rating, and discharge education score.
Research aim:
To examine whether waiting time, age, nurse communication rating, and discharge education score predict patient satisfaction.
Research question:
Do waiting time, age, nurse communication rating, and discharge education score predict patient satisfaction among discharged patients?
Outcome variable:
Patient satisfaction score.
Predictor variables:
Waiting time, age, nurse communication rating, and discharge education score.
Why multiple regression may fit:
Multiple regression may fit because the outcome is continuous and the student wants to test several predictors together.
How the data should be arranged:
Each row should represent one patient or participant. Each column should represent one variable. The outcome variable should be in one column, and the predictor variables should be in separate columns.
Hypothetical Excel Regression Output Example
The table below is fictional and is included only to show how students may interpret Excel regression output.
| Predictor | Hypothetical coefficient | Hypothetical p-value | Dissertation interpretation |
|---|---|---|---|
| Waiting time | -0.18 | .021 | Longer waiting time may predict lower satisfaction scores |
| Age | 0.03 | .410 | Age may not meaningfully predict satisfaction in this example |
| Nurse communication rating | 0.72 | < .001 | Better communication may predict higher satisfaction |
| Discharge education score | 0.31 | .008 | Stronger discharge education may predict higher satisfaction |
If the model had a hypothetical R-squared of .46, the student could say that the predictors explained 46% of the variation in patient satisfaction scores. This does not prove causation. It only describes prediction within the sample.
Sample APA-Style Results Paragraph
A multiple linear regression was conducted to examine whether waiting time, age, nurse communication rating, and discharge education score predicted patient satisfaction. The hypothetical model was statistically significant, F(4, 95) = 20.24, p < .001, and explained 46% of the variance in satisfaction scores, R² = .46, adjusted R² = .44. In this example, nurse communication rating and discharge education score positively predicted satisfaction, while waiting time negatively predicted satisfaction. Age was not a meaningful predictor. These findings should be interpreted cautiously because regression prediction does not establish causation, and Excel provides limited tools for advanced diagnostics and validation.
APA-style statistical reporting should include the model type, outcome variable, predictors, test statistic where available, degrees of freedom, p-values, R-squared, adjusted R-squared, coefficients, confidence intervals where available, and plain-language interpretation. APA guidance recommends reporting exact p-values where possible, except values below .001, which are commonly reported as p < .001 (American Psychological Association, 2024).
Students who need help turning Excel output into dissertation-ready results can use dissertation data analysis help or regression analysis help.
Example: Forecasting Clinic Visits in Excel
A public health nursing student has monthly clinic visit data for two years and wants to forecast future service demand.
The data should be arranged with dates or months in one column and clinic visit counts in another column. The dates must be in proper time order. Missing months should be corrected or explained because gaps can weaken the forecast.
Two years of monthly data gives 24 time points. This may be enough for a basic classroom or dissertation example, but longer time series are usually stronger because they show more stable patterns, possible seasonality, and unusual periods.
Seasonality matters. For example, clinic visits may rise during certain months because of school calendars, seasonal infections, public health campaigns, or local service changes. If the pattern repeats, the forecast may need to account for it.
Forecast Sheet can create a forecast with upper and lower confidence bounds. These bounds show uncertainty around the forecast. A wider interval means more uncertainty. Forecasting guidance explains that prediction intervals often widen as the forecast horizon increases because future values become harder to estimate (Hyndman & Athanasopoulos, 2021).
A dissertation interpretation may say:
Excel Forecast Sheet was used to estimate future monthly clinic visits based on 24 months of historical data. The forecast suggested a possible increase in service demand over the next three months. However, the forecast should be interpreted cautiously because it assumes that past patterns continue, and it may be affected by missing months, seasonal changes, policy changes, staffing changes, or unusual service disruptions.
For broader healthcare prediction methods beyond Excel forecasting, see predictive data analysis in healthcare research.
How to Interpret Excel Predictive Modeling Output
| Excel output term | Meaning | Dissertation interpretation |
|---|---|---|
| Coefficient | Estimated change in the outcome for a one-unit change in the predictor | Shows direction and size of the predictor’s contribution |
| Intercept | Predicted outcome when predictors are zero | Often less meaningful clinically unless zero is realistic |
| R-squared | Proportion of outcome variation explained by the model | Helps describe model fit |
| Adjusted R-squared | R-squared adjusted for number of predictors | Better when comparing models with different predictors |
| Standard error | Uncertainty around an estimate | Smaller values suggest more precise estimates |
| p-value | Evidence against the null hypothesis | Should be interpreted with effect size and context |
| Confidence interval | Range of plausible values for an estimate | Shows precision and uncertainty |
| Residual | Difference between observed and predicted value | Helps identify prediction error |
| Predicted value | Model-estimated value for a case | Shows what the model estimates for each case |
| Forecast interval | Range around a forecasted future value | Shows uncertainty in future predictions |
Students should not report Excel output without interpretation. A strong dissertation explains what the result means for nursing research, not only what the spreadsheet produced. For p-value interpretation, see p-values in nursing research.
Common Mistakes Students Make With Predictive Modeling in Excel
Students often treat Excel as suitable for every predictive model. It is not. Excel can support basic prediction, but it is limited for advanced healthcare modelling.
A major mistake is using ordinary linear regression for categorical outcomes. If the outcome is readmitted/not readmitted, fall/no fall, infected/not infected, or adherent/non-adherent, Excel is usually not enough. These binary outcomes normally require logistic regression in SPSS, R, Stata, or Python.
Students also make mistakes with dirty or poorly coded data. Missing values, duplicate records, inconsistent categories, and wrong variable coding can weaken prediction results.
Other common mistakes include misreading R-squared, treating p-values as proof of causation, forgetting assumptions, using trendlines as final dissertation analysis, reporting output without interpretation, and making clinical claims from weak prediction results.
If your project involves hypothesis testing and statistical interpretation, inferential data analysis in nursing research can help you understand how prediction relates to statistical inference.
Limitations of Predictive Modeling in Excel
Excel is limited when students need logistic regression, Cox regression, ROC/AUC analysis, train/test splits, cross-validation, random forests, gradient boosting, neural networks, reproducible code, advanced diagnostic plots, or publication-level statistical reporting.
These limitations matter because many nursing dissertations require more than a simple prediction. A supervisor may ask for assumptions, validation, effect sizes, confidence intervals, model diagnostics, APA-style tables, or a stronger explanation of model choice.
Excel is still useful for data organization, early exploration, simple regression, basic forecasting, and preparing data for SPSS, R, Stata, or Python. But it should not be forced into tasks it was not designed to handle.
Excel vs SPSS, R, Stata, and Python for Predictive Modeling
| Tool | Best for | Predictive modeling strength | Main limitation | Best nursing student use case |
|---|---|---|---|---|
| Excel | Basic regression, charts, simple forecasting | Easy and accessible | Weak for advanced models and validation | Early exploration and simple prediction |
| SPSS | Menu-based regression and statistics | Stronger than Excel for dissertation analysis | Less flexible for advanced machine learning | Students who need supervisor-friendly output |
| R | Advanced statistics and reproducible analysis | Very strong | Requires coding | Advanced quantitative dissertations |
| Stata | Regression, public health, survival analysis | Strong for health research | Requires syntax knowledge | Public health and health-services research |
| Python | Machine learning and advanced prediction workflows | Very strong | Requires programming | Large datasets and advanced prediction projects |
Excel is good for basic regression and simple forecasting. SPSS is often better for nursing students who need menu-based regression and clearer dissertation output. R is strong for advanced statistics and reproducible analysis. Stata is strong for regression and health research. Python is strong for machine learning and advanced prediction workflows.
Students who are unsure which tool fits their project can review types of data analysis in research before choosing a final method.
Is Excel Enough for a Nursing Dissertation?
Excel may be enough for preliminary exploration, simple regression, and basic forecasting. It may also be acceptable if the study has a small dataset, a continuous outcome, simple predictors, and a supervisor who approves Excel-based analysis.
However, many nursing dissertations require SPSS, R, Stata, or Python for stronger statistical analysis, categorical outcomes, advanced modelling, validation, reproducibility, or APA-ready reporting.
Before relying on Excel, check your supervisor’s expectations, university guidelines, outcome variable type, required model, assumptions, validation requirements, and reporting expectations.
Checklist: Is Excel Enough for My Predictive Modeling Project?
Excel may be enough if:
- The outcome is continuous.
- The model is simple linear or multiple regression.
- The dataset is small and clean.
- Your supervisor accepts Excel output.
- Advanced validation is not required.
- You can explain the limitations clearly.
Excel is probably not enough if:
- The outcome is categorical.
- You need logistic regression or Cox regression.
- You need ROC/AUC analysis.
- You need cross-validation or train/test splitting.
- You need machine learning.
- You need reproducible code.
- Your supervisor requires SPSS, R, Stata, or Python.
If your project has moved beyond Excel, request expert data analysis help before wasting time on the wrong tool.
When to Get Help With Predictive Modeling in Excel
Students may need help when they are unsure whether Excel is acceptable, their outcome variable is categorical, their dataset needs cleaning or coding, or regression output is confusing.
You may also need support if your supervisor asks for SPSS, R, Stata, or Python instead of Excel. This often happens when the dissertation requires logistic regression, survival analysis, ROC/AUC, advanced assumptions, model validation, or APA-ready reporting.
If you need help with predictive modeling in Excel for a nursing dissertation, Nursing Dissertation Help can assist with data cleaning, regression setup, Excel analysis, SPSS/R/Stata/Python support, interpretation, results writing, and APA 7th edition reporting.
For cost planning, review nursing dissertation help pricing and request a clear quote based on your dataset, software, deadline, and chapter requirements.
FAQs About Predictive Modeling in Excel
Can Excel be used for predictive modeling?
Yes. Excel can be used for basic predictive modeling, including simple linear regression, multiple regression, trendline prediction, Forecast Sheet forecasting, and what-if analysis.
What predictive modeling methods can I use in Excel?
You can use Excel for linear regression, multiple regression, chart trendlines, Forecast Sheet forecasting, and basic what-if analysis.
Can Excel do regression analysis?
Yes. Excel can perform regression analysis through the Data Analysis ToolPak or statistical functions in the desktop version.
Can Excel predict healthcare outcomes?
Excel can estimate simple continuous outcomes or forecast time-based healthcare trends, but results should be used for research and education only, not diagnosis or clinical decisions.
Is Excel enough for a nursing dissertation?
Sometimes. Excel may be enough for basic regression or simple forecasting if the supervisor approves it. More advanced dissertations usually need SPSS, R, Stata, or Python.
Can Excel do logistic regression?
Excel is not ideal for logistic regression. If the outcome is binary, such as readmitted/not readmitted, students should usually use SPSS, R, Stata, or Python.
What is the Data Analysis ToolPak in Excel?
The Data Analysis ToolPak is an Excel add-in that provides basic statistical procedures, including regression.
Can Excel forecast patient visits or staffing demand?
Yes. Excel Forecast Sheet can help forecast time-based data such as clinic visits, staffing demand, infection trends, or missed appointments, if the historical data are suitable.
Is SPSS better than Excel for predictive modeling?
For dissertation analysis, SPSS is often better because it provides stronger statistical output, clearer regression options, and more supervisor-friendly results.
When should I use R, Stata, or Python instead of Excel?
Use R, Stata, or Python when you need advanced modelling, logistic regression, Cox regression, machine learning, reproducible code, train/test validation, or complex healthcare prediction workflows.
Conclusion
Excel can be useful for simple predictive modeling, regression, forecasting, and early data exploration in nursing research. It is familiar, accessible, and helpful when students need to organize data, create charts, explore trends, or run basic regression.
However, Excel has limits. It is not the best tool for categorical outcomes, logistic regression, Cox regression, ROC/AUC analysis, machine learning, complex validation, reproducible code, or advanced dissertation-ready reporting.
If your nursing dissertation requires stronger predictive modeling, data cleaning, regression analysis, SPSS/R/Stata/Python support, interpretation, or APA 7th edition results writing, Nursing Dissertation Help can help you choose the right tool and report your findings clearly.
References
American Psychological Association. (2024). Numbers and statistics guide [PDF]. APA Style.
Hyndman, R. J., & Athanasopoulos, G. (2021). Forecasting: Principles and practice (3rd ed.). OTexts.
Microsoft Support. (n.d.). Add a trend or moving average line to a chart. Microsoft.
Microsoft Support. (n.d.). Create a forecast in Excel for Windows. Microsoft.
Microsoft Support. (n.d.). Introduction to What-If Analysis. Microsoft.
Microsoft Support. (n.d.). Load the Analysis ToolPak in Excel. Microsoft.
Microsoft Support. (n.d.). Perform a regression analysis. Microsoft.
