

Introduction
Many nursing students finish data collection and then struggle with SPSS data entry. The data may come from paper questionnaires, Google Forms, Excel, Qualtrics, REDCap, clinical audit forms, or patient satisfaction surveys, but the problem is the same: how should the file be set up before analysis?
The confusion often starts with SPSS Variable View, SPSS Data View, value labels, missing values, Likert-scale coding, reverse-worded items, and unclear variable names. A small mistake at this stage can affect descriptive statistics, inferential tests, APA tables, graphs, and interpretation.
Accurate SPSS data entry protects the quality of nursing research. A dataset with clear labels, consistent numeric codes, documented missing values, and a codebook is easier to analyze and defend.
Need help setting up your SPSS dataset? Our SPSS Data Analysis Help service can help you enter questionnaire data, create variable labels, code response options, define missing values, and prepare your nursing research dataset for analysis.
What Is SPSS Data Entry?
SPSS data entry means organizing research data into an SPSS file so each row, column, code, label, and missing-value rule is ready for analysis.
In nursing research:
- Each row usually represents one participant, patient, record, or case.
- Each column represents one variable.
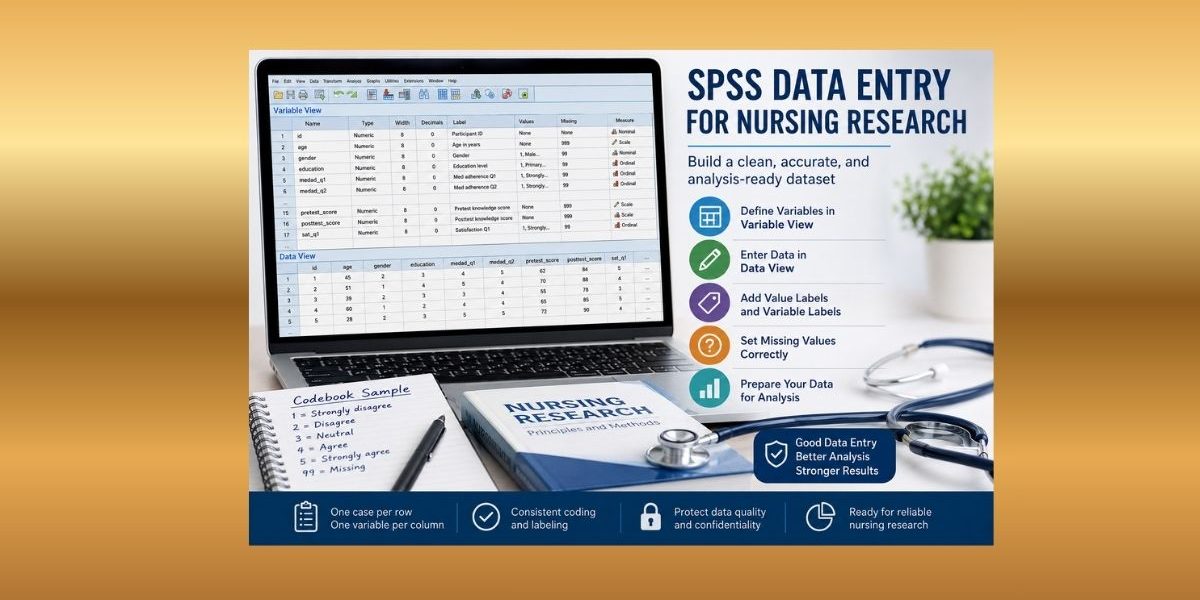
- Variable View defines the structure of the dataset.
- Data View contains the actual data values.
For example, columns may include age, gender, education level, blood pressure category, pain score, medication adherence item 1, satisfaction item 1, pretest score, and posttest score.
IBM explains that Variable View stores variable attributes such as variable name, data type, decimals, variable labels, value labels, user-defined missing values, and measurement level (IBM, n.d.-a). This makes data entry more than typing values. It is the process of building an analysis-ready structure.
Why SPSS Data Entry Matters in Nursing Research
Correct SPSS data entry matters because nursing research often uses coded questionnaire responses, clinical measures, and demographic data. If these are entered inconsistently, the analysis may produce misleading results.
For example, a patient satisfaction survey may use 1 = Strongly disagree and 5 = Strongly agree. If one student enters “Strongly agree,” another enters “SA,” and another enters “5,” SPSS may not treat the responses as one variable.
Good data entry helps you:
- Reduce coding errors
- Protect data integrity
- Help SPSS read variables correctly
- Prepare accurate tables and graphs
- Make supervisor review easier
- Avoid errors in APA reporting
- Prepare for descriptive and inferential analysis
Nursing research methods texts emphasize careful data collection, management, and analysis because research findings depend on the quality of the data collected and prepared (Gray et al., 2025).
SPSS Data Entry vs SPSS Coding vs Data Cleaning
SPSS coding means assigning numeric codes, value labels, missing-value codes, reverse coding, dummy coding, or recoding variables, while SPSS data entry means putting data into SPSS correctly. For SPSS data cleaning, this means checking for entry mistakes, duplicate records, missing values, outliers, inconsistent coding, and impossible values.
This article focuses on data entry and dataset setup. It does not replace a full SPSS coding, syntax, descriptive statistics, or data cleaning guide.
After data entry, use Data Cleaning Steps in Nursing Research to check coding errors, duplicates, outliers, missing values, and inconsistent entries.
Before Entering Data in SPSS
Do not open SPSS and begin typing randomly. First, prepare the documents that guide the dataset.
You need:
- Research questions
- Questionnaire or survey tool
- Clinical audit form
- Variable list
- Codebook
- Response options
- Missing-value rules
- Participant ID system
- Excel, REDCap, Google Forms, or Qualtrics export
- Consent and confidentiality requirements
Your SPSS file should match the study instrument. If the questionnaire has 10 medication adherence items, the SPSS file should usually have 10 separate medication adherence columns. If the study has pretest and posttest scores, each score should have its own variable.
How to Create a Codebook Before SPSS Data Entry
A codebook explains how each variable should appear in SPSS. It helps you enter data consistently and makes the dataset easier to review later.
A codebook should include:
- Variable name
- Variable label
- Question wording
- Response options
- Numeric codes
- Value labels
- Missing-value code
- Measurement level
- Reverse-coding note
- Scale or subscale membership
Mini codebook sample:
| Variable name | Variable label | Coding | Measure | Missing |
|---|---|---|---|---|
| gender | Participant gender | 1 = Male, 2 = Female, 3 = Prefer not to say | Nominal | 99 |
| age | Age in years | Enter actual age | Scale | 999 |
| q1_confidence | Confidence explaining medication instructions | 1 = Strongly disagree to 5 = Strongly agree | Ordinal or Scale | 99 |
| pretest_score | Medication knowledge pretest score | 0–100 | Scale | 999 |
| posttest_score | Medication knowledge posttest score | 0–100 | Scale | 999 |
The UK Data Service recommends documenting variable labels, codes, data types, missing values, and codebook details so quantitative datasets can be understood correctly (UK Data Service, n.d.).
Understanding Variable View in SPSS
Variable View is where you define each variable before entering data.
The most important fields are:
- Name: Short variable name, such as age, gender, or q1_confidence.
- Type: Numeric, string, date, or another format.
- Decimals: Number of decimal places.
- Label: Full description of the variable.
- Values: Numeric codes and their meanings.
- Missing: User-defined missing-value codes.
- Measure: Nominal, ordinal, or scale.
For example, for gender, enter gender under Name. Under Label, enter Participant gender. Under Values, define 1 = Male, 2 = Female, and 3 = Prefer not to say, and under Missing, define 99 if 99 means no response. For Measure, select Nominal.
For a pain score from 0 to 10, the variable may be numeric, labeled Patient pain score, and measured as Scale.
Understanding Data View in SPSS
Data View is where the actual participant data are entered. IBM describes Data View as the view that displays actual data values or defined value labels (IBM, n.d.-b).
Each row should be one participant or case. Each column should be one variable.
Example:
| id | age | gender | pretest_score | posttest_score | satisfaction_q1 |
|---|---|---|---|---|---|
| 001 | 45 | 2 | 62 | 84 | 5 |
| 002 | 51 | 1 | 70 | 88 | 4 |
| 003 | 39 | 2 | 55 | 78 | 3 |
Do not mix words and numbers in the same coded variable. If gender is coded as 2 = Female, enter 2 in Data View, not “Female.”
How to Enter Questionnaire Data in SPSS
Use these steps:
- Open SPSS.
- Go to Variable View.
- Create one variable for each questionnaire item or study variable.
- Add short variable names.
- Add full variable labels.
- Click the Values cell for each categorical variable.
- Add each numeric code and its value label.
- Click the Missing cell if using a missing-value code.
- Enter the missing-value code, such as 99 or 999.
- Set Measure as nominal, ordinal, or scale.
- Switch to Data View.
- Enter one participant per row.
- Enter numeric codes consistently.
- Save the file as an SPSS .sav file.
- Keep a raw backup before editing.
This process is especially important for SPSS questionnaire data entry because each item must be traceable from the questionnaire to the dataset.
How to Code Common Nursing Research Variables in SPSS
Demographic variables include gender, age, education level, marital status, and employment status. Gender and marital status are usually nominal. Education level may be ordinal if arranged from lowest to highest qualification. Age is usually scale if entered in years.
Clinical variables include diagnosis category, pain score, blood pressure category, length of stay, number of medications, wound status, readmission status, or fall-risk category. Diagnosis category is nominal. Pain score and length of stay are usually scale.
Survey variables include knowledge items, satisfaction items, confidence ratings, adherence scales, and attitude scales. These are often entered with numeric codes and value labels.
Do not expand this stage into full recoding or analysis. Advanced SPSS data coding, reverse coding, dummy coding, and computed scale scores should be done after the raw dataset is safely entered and backed up.
How to Enter Likert-Scale Data in SPSS
Likert scale data in SPSS should usually be entered using numeric codes.
Example:
1 = Strongly disagree
2 = Disagree
3 = Neutral
4 = Agree
5 = Strongly agree
Enter these codes under Values in Variable View. Then type only the number in Data View.
Keep the direction consistent. If higher scores mean stronger agreement, greater confidence, or higher satisfaction, check whether any item is reverse-worded. Mark reverse-worded items in the codebook before later scoring.
Do not type “Strongly agree” into each cell. Value labels allow SPSS to display the meaning while keeping the data numeric.
How to Handle Missing Values During SPSS Data Entry
Missing values should follow a clear rule. Never guess missing responses.
A missing value may occur when a participant skips a question, a follow-up form is incomplete, a lab result is unavailable, or a patient withdraws.
You may leave cells blank if that is your planned method. You may also use a code such as 99 or 999, but only if that code cannot be confused with a real value.
Do not use 0 as missing if 0 is a possible real response. For example, 0 may be a valid pain score, number of falls, or number of readmissions.
Define the missing code in Variable View and record the rule in the codebook.
Importing Excel or Survey Data Into SPSS
SPSS data entry may involve importing data from Excel, Google Forms, REDCap, or Qualtrics instead of typing manually.
Before importing:
- Use variable names in the first row.
- Keep one participant per row.
- Keep one variable per column.
- Remove merged cells.
- Remove titles, comments, and blank rows.
- Check that numeric variables are not stored as text.
- Save a raw copy before editing.
IBM explains that Excel files can be imported through File > Import Data > Excel, and SPSS can read variable names from the first row when selected during import (IBM, n.d.-c). For Excel organization before SPSS import, see Using Excel for Data Analysis in Nursing.
Common SPSS Data Entry Mistakes in Nursing Research
Common mistakes include:
- Entering response words instead of numeric codes
- Mixing codes within the same variable
- Forgetting value labels
- Forgetting variable labels
- Coding missing values as real values
- Using 0 incorrectly
- Placing several questionnaire items in one column
- Mixing participants and variables
- Entering Likert items in the wrong direction
- Forgetting to flag reverse-coded items
- Editing the raw dataset without a backup
- Leaving patient identifiers in the analysis file
If your SPSS file has unclear codes, missing labels, mixed responses, or questionnaire data that is difficult to analyze, our Dissertation Data Analysis Help service can help you organize the dataset before analysis.
SPSS Data Entry Checklist for Nursing Students
Before analysis, confirm that:
- Raw data are saved safely
- Participant IDs are created
- Direct identifiers are removed or protected
- Variable names are clear
- Variable labels are added
- Value labels are added
- Missing-value codes are defined
- Measurement levels are checked
- Likert items are coded consistently
- Reverse-coded items are flagged
- Each row is one case
- Each column is one variable
- Out-of-range values are checked
- The dataset is saved as .sav
- The codebook is saved separately
This checklist is useful for SPSS data entry for nursing dissertation projects, capstones, theses, DNP projects, and quality improvement studies.
What Happens After SPSS Data Entry?
After data entry, check the dataset before running final analysis. Start with frequencies for categorical variables. Review means and standard deviations for continuous variables. Inspect missing values, out-of-range values, and unusual entries.
Then run preliminary descriptive statistics to summarize demographic, clinical, and questionnaire variables. For the next stage, see Descriptive Data Analysis in Nursing Research.
Do not move to hypothesis testing until the dataset is entered, labeled, checked, and saved correctly.
SPSS Data Entry Example for Nursing Research
A nursing student collects data from 120 patients using a demographic form, a 10-item medication adherence questionnaire, pretest and posttest knowledge scores, and a 5-item patient satisfaction scale.
The SPSS file may include:
- id: Participant ID
- age: Age in years
- gender: 1 = Male, 2 = Female, 3 = Prefer not to say
- education: 1 = Primary, 2 = Secondary, 3 = College, 4 = University
- medad_q1 to medad_q10: Medication adherence items coded 1 to 5
- pretest_score: Knowledge score before education
- posttest_score: Knowledge score after education
- sat_q1 to sat_q5: Satisfaction items coded 1 to 5
- missing code: 99 for skipped survey items, if defined
Each patient is entered on one row. Each questionnaire item has its own column. Likert items use value labels. Pretest and posttest scores are entered as scale variables. Missing values are documented in the codebook.
This dataset is now ready for cleaning, descriptive summaries, reliability checks, and planned inferential analysis.
When to Get Help With SPSS Data Entry
You may need expert support when paper questionnaires must be entered into SPSS, Excel files need conversion, Variable View is confusing, value labels are missing, or Likert-scale coding is inconsistent.
Help is also useful when reverse-coded items are unclear, missing values are not defined, or a supervisor asks for dataset corrections before analysis.
Professional SPSS Data Analysis Help can support questionnaire entry, SPSS value labels, missing-value setup, codebook preparation, and dataset preparation before analysis.
Conclusion
SPSS data entry is the foundation of reliable nursing research analysis. A strong SPSS dataset should have clear variable names, full variable labels, value labels, missing-value rules, consistent coding, participant IDs, and a documented codebook.
When the dataset is organized correctly, the analysis becomes easier to run, interpret, report, and defend. Good data entry reduces avoidable mistakes in tables, graphs, statistics, and final dissertation results.
Need expert help making your SPSS dataset analysis-ready? Upload your questionnaire, raw data, research questions, and rubric through our SPSS Data Analysis Help page for support with data entry, value labels, missing values, and dataset preparation.
FAQs
What is SPSS data entry?
SPSS data entry is the process of entering and organizing research data in SPSS so each case, variable, code, label, and missing-value rule is ready for analysis.
How do I enter questionnaire data in SPSS?
Create one variable for each questionnaire item in Variable View. Add variable labels, value labels, missing-value rules, and measurement levels. Then enter one participant per row in Data View.
What is the difference between Variable View and Data View in SPSS?
Variable View defines the dataset structure, including names, labels, values, missing values, and measurement levels. Data View contains the actual participant responses.
How do I code Likert-scale data in SPSS?
Use numeric codes such as 1 = Strongly disagree through 5 = Strongly agree. Add the meanings as value labels in Variable View, then enter the numeric codes in Data View.
How should missing values be entered in SPSS?
Use a planned missing-value rule. You may leave cells blank or use a code such as 99 or 999, but the rule must be defined in Variable View and documented in the codebook.
References
Gray, J. R., Grove, S. K., & Cipher, D. J. (2025). Burns & Grove’s the practice of nursing research: Appraisal, synthesis, and generation of evidence (10th ed.). Elsevier.
IBM. (n.d.-a). Variable View. IBM SPSS Statistics Documentation. Retrieved June 17, 2026.
IBM. (n.d.-b). Data Editor. IBM SPSS Statistics Documentation. Retrieved June 17, 2026.
IBM. (n.d.-c). Reading Excel files. IBM SPSS Statistics Documentation. Retrieved June 17, 2026.
UK Data Service. (n.d.). Data documentation: Quantitative data. Retrieved June 17, 2026.
